
“If you’re in the market, you have to know there’s going to be declines.”
-Peter Lynch
Corrections and market rebounds
At a symposium organized by the Brookings Institute in New York, Fed Chairman Jerome Powell indicated moderating the intensity of rate hikes going forward, all but locking in a 0.50% increase in the Fed Funds rate at the December 14th FOMC meeting. This is significant because the Fed raised by 0.75% at each of its last four meetings in June, July, September, and November. While the Chairman reiterated his commitment to tightening monetary policy until inflation abates, the markets discerned a genuine softening of tone, suggesting smaller rate hikes ahead. The equity markets rallied sharply in response, and longer-term bond yields continued their month-long declines. The S&P 500 ended November up 5.38%, while the tech-heavy NASDAQ ended up 3.29%. With the strong recent rally, the S&P 500 is now firmly out of “bear market territory” now down (14.39)% YTD. The more interest rate sensitive NASDAQ is still languishing below the bear market threshold of negative (20)% – YTD, the index is down (26.70)%. Meanwhile, bond yields fell significantly across longer maturities after the October CPI released in early November showed headline inflation fall from 8.2% to 7.7%. The Bloomberg Aggregate Bond Index returned an estimated +3.68% during the month and is now down (12.62)% YTD.
us Equities – S&P since 1928i
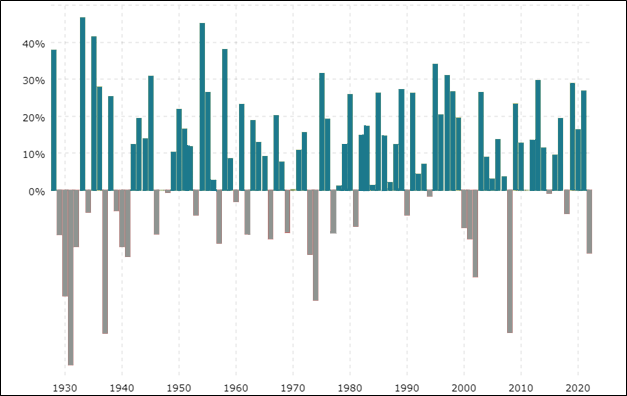
While trending in the right direction, 2022 will likely be remembered as a year of sharp declines in the financial markets. But this needs to be put in context. Since the last bear market in 2008 – see chart above, the S&P 500 has returned 13.7% on an annually, with just two down years in 2015 and 2018. Looking at history, the S&P has rebounded from a bear market, defined as a decline of greater than (20)%, in every instance in the subsequent year. The period between 1930 through 1932 is the only exception. Even during the inflation shock of 1973 and 1974 when the market was down ~(17)% and ~(30)% respectively, the subsequent two years saw strong gains of ~32% and 19% in 1975 and 1976, respectively. In similar vein, the ~(23)% drawdown in 2002 was accompanied by a ~26% rally in 2003; the ~(38)% pullback in 2008 was followed by a 23% rally in 2009. The point here is not to suggest 2023 will be a positive year – we cannot predict market returns. Rather, the point is to illustrate that market declines are normal, and subsequent recoveries more than offset periodic declines. In short, investors who hold US stocks long-term can be expected to earn a positive rate of return over time. Experience Positive real returns are just not a statistical fluke; we at Trajan Wealth believe the historical performance of US stocks has real, economic underpinnings. US businesses have a demonstrable track record of generating and growing profits through innovation, entrepreneurship, and value creation. While experiencing down years are part of investing, in the words of Peter Lynch – “If you’re in the market, you have to know there’s going to be declines”; not staying invested is a decidedly bad idea for individuals who have sufficient time and earnings horizons, and by extension the ability to withstand market volatility.
US Fixed Incomeii
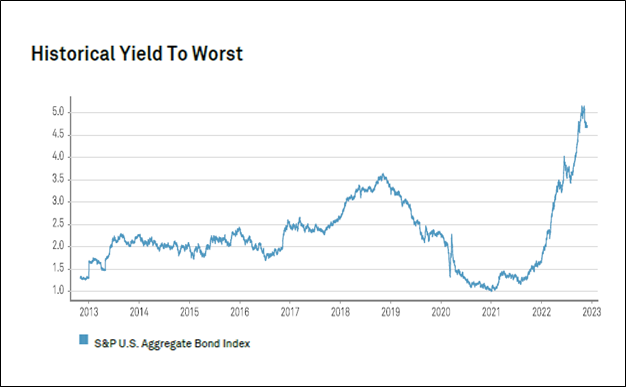
In the US fixed income market, following the cumulative 375 basis points of Fed rate hikes thus far in 2022 and an anticipated 50 basis point tightening in December, YTD performance of investment grade bonds is at (12.62)%. It has been the worst since the inception of the flagship Bloomberg Aggregate Intermediate Bond Index in January 1976. However, with higher yields, the fixed income asset class offers its best risk/reward characteristics in over a decade.
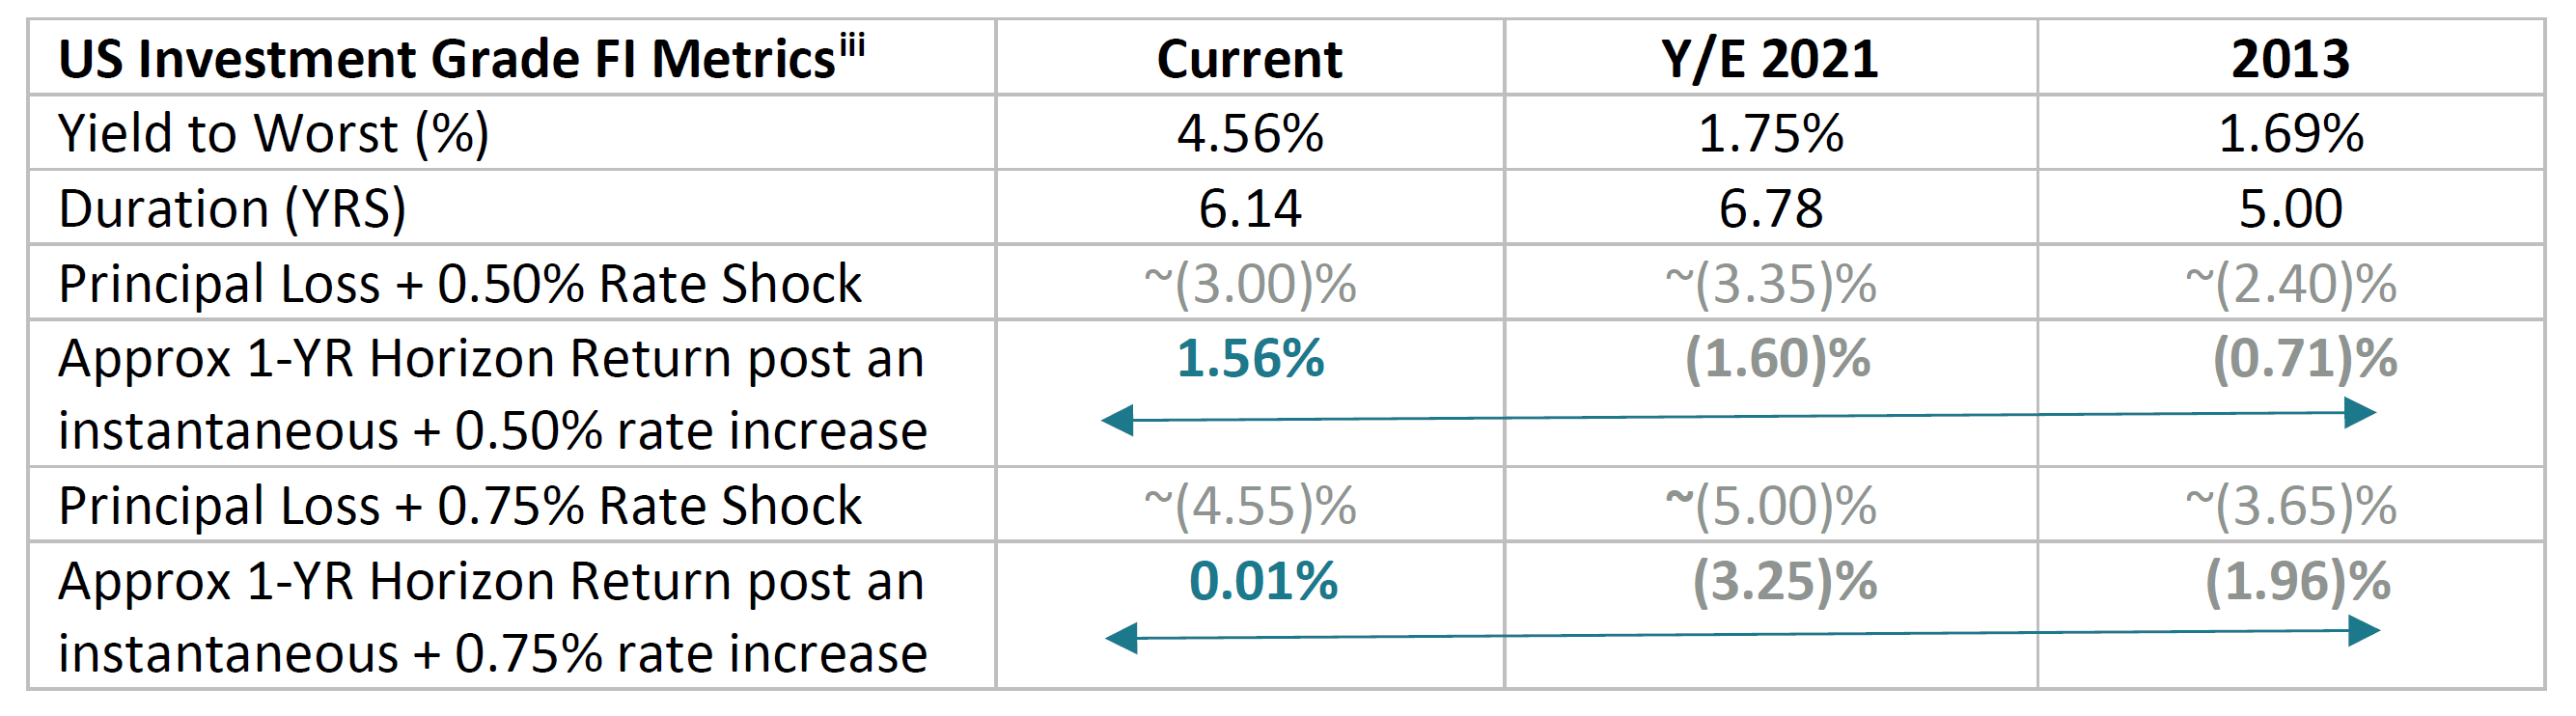
As illustrated in the above chart (marked “US Fixed Income” – Historical Yield to Worst), fixed income yields have more than doubled since the end of 2021, rising from 1.75% to about 4.56% at the overall index level. The duration – a measure of interest rate sensitivity, has declined from about 6.80 years to a little over 6.10 years. Why is this important? While we cannot predict future interest rates with any claim to historic accuracy, current bond market characteristics ensure that if future yields remain range bound within a 75-basis point (or 0.75%) bandwidth, investors will almost certainly have a positive rate of return, other things being equal. As depicted in the above chart, this has not been the case for at least the past decade. The middle column in the above table depicts bond market characteristics at the start of 2021. With initial yields at 1.75% and interest rate risk close to 7 years, it is not surprising that we have had the worst market performance as market interest rates on 5 to 10-year maturities increased by almost 2.75% during the year. Going forward, though, higher current market yields, along with the fact that the bulk of Fed tightening may be behind us, drives a much better risk-reward profile for investors in fixed income. We would certainly advocate increased allocations to the asset class for investors who require a measure of controlled volatility in their retirement portfolios.
Risk Factors Going into 2023
As we look forward into 2023, certain risk factors that could impact the markets are the continued supply chain issues emanating from China’s “Zero-Covid 19” policies and the level of global indebtedness. While the former is largely a geopolitical issue, the impact could be inflationary with shortages of many finished goods productions inputs, or disinflationary. A sharp slowdown in China decreases overall global demand and key commodity prices. As investment practitioners with little insight into Chinese policy making, and given opaqueness of data collection processes in China, we are unfortunately unable to take an educated stance on what might transpire. Our mitigation processes to contain the most adverse outcomes include diversification and a certain “home country bias” (towards the USA).
Global indebtedness – Relatively Speakingiv
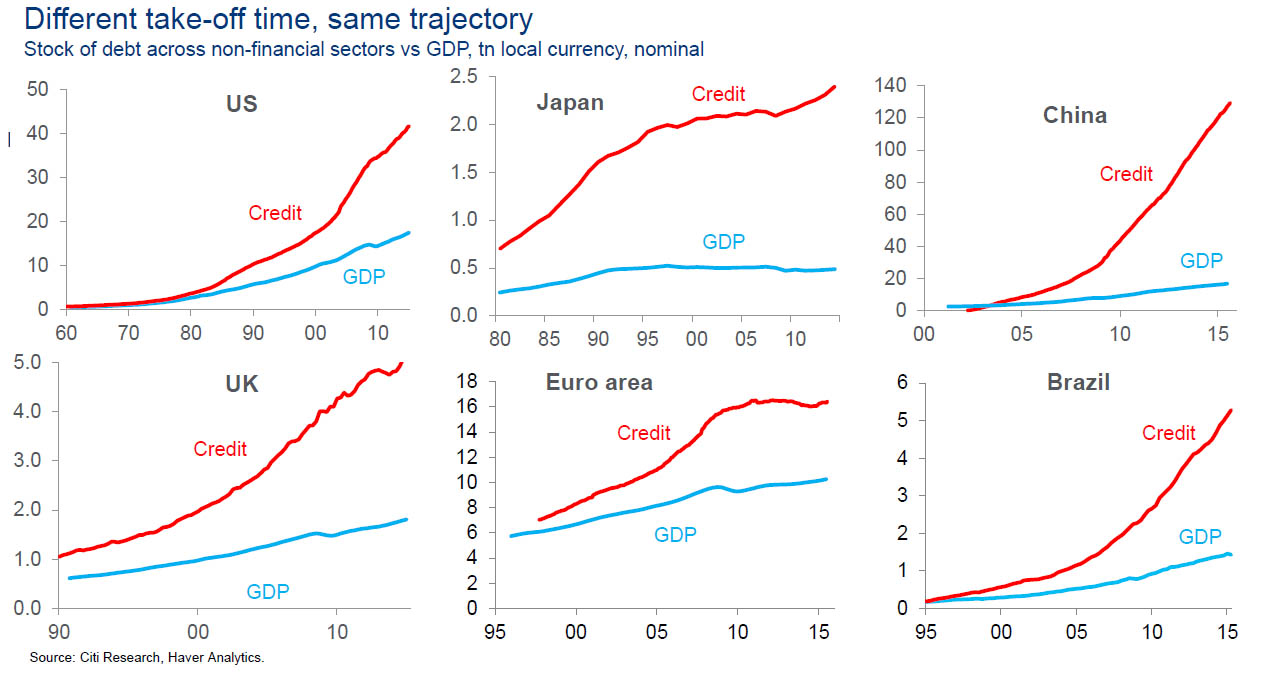
In view of the rising levels of global indebtedness, our risk mitigation processes are no different. True, non-bank debt levels in the USA have been growing alarmingly, especially when viewed within the context of overall GDP. The economic impact is further exacerbated by rising interest rates, thereby increasing debt service costs. However, before capitulating to talk of impending gloom and doom, it is important to note that investment decisions and financial flows are predicated on the relative growth and inflation prospects of all alternatives within the investible universe. As depicted in chart 4 above, the US does indeed have a growing Debt/GDP problem. With about $40 trillion in non-financial sector debt outstanding in 2015, the Debt to GDP ratio crossed 200%. However, this low/at par against large competitors – in line with western Europe Brazil and significantly lower vs. UK and China. Thus, if the any impending slowdown raises questions regarding solvency and debt servicing capabilities, it seems reasonable to believe that the US markets will experience large capital inflows from international investors, lowering the cost of capital for US business, thereby stimulating a speedier and more sustained recovery.
recommendations
As alluded to earlier, we continue to advocate an elevated level of diversification across asset classes following individual risk-tolerance thresholds. In this context, Fixed Income assets should command a higher weighting. However, we also believe that non-traditional asset classes – “real assets,” such as real estate, merit consideration, considering persisting inflationary pressures. We also expect elevated levels of market volatility going forward, if only due to rapidly rising financing costs that may adversely affect corporate profits. In such an environment, other strategies include absolute return strategies while others are trend following such as equity/credit market dispersion, which benefit from volatility for investors in an overall asset allocation. We continuously look for these unique sources of returns for our clients and will make recommendations as we develop additional strategies and update our asset allocation models.
In summary, with higher financing costs, lower projected growth, and an uncertain geopolitical environment, we would advocate a distinctive “quality bias” in overall portfolio management, overweighting issuers with low debt and discernible pricing power. History has proven the efficacy and regeneration capacity of the U.S. economy and U.S. financial markets in periods of economic and market distress – the self-correcting mechanisms of capitalism and free enterprise have decisively delivered better outcomes than its alternatives. As such, we are maintaining a measure of “home country bias” in our portfolio construction strategies.
UDAYAN MITRA, CFA
Trajan Wealth Chief Investment Officer