“Trying to predict the direction of the market over one year, or even two years is impossible.”
- Peter Lynch
Public Equities
2025 Public Equities Forecast
| Index | YTD 2024 Returnsi | PE Ratioii | Earnings Yield | B/E Inflation | Exp. Return (Full Cycle) | Return Range – using 25% error rate |
|---|---|---|---|---|---|---|
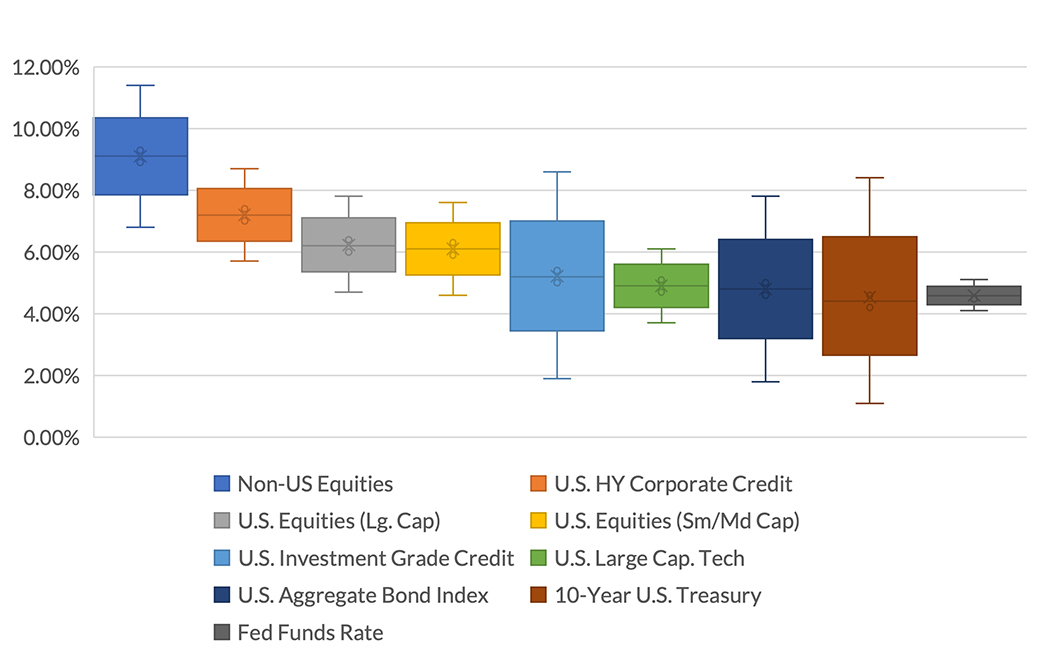
| US Large Cap - S&P 500 | 29.2% | 25.7x | 3.9% | 2.3% | 6.2% | 4.7% to 7.8% |
| US Large Cap – Tech Heavy NASDAQ | 35.3% | 37.8x | 2.6% | 2.3% | 4.9% | 3.7% to 6.1% |
| International Equity – MSACWI ex US | 8.9% | 14.7x | 6.8% | 2.3% | 9.1% | 6.8% to 11.4% |
| US Small/Mid Cap – Russell 2500 | 18.1% | 26.6x | 3.8% | 2.3% | 6.1% | 4.6% to 7.6% |
Fixed Income
2025 Fixed Income Forecast
| Index | YTD 2024 Returns | Durationiii | Yield | Avg. Credit Quality | Exp. Return (Full Cycle) | Return Range – using +/- 50bps rate change |
|---|---|---|---|---|---|---|
| Fed Funds Rate | 5.2% | O/N | 4.6% | Benchmark | 4.6% | 4.1% to 5.1% |
| 10Yr US Treasury | 4.4% | 7.9 | 4.4% | Benchmark | 4.4% | 1.1% to 8.4% |
| US Aggregate Bond Index | 2.0% | 6.2 | 4.8% | AA2/AA3 | 4.8% | 1.8% to 7.8% |
| US IG Corporate Index | 3.2% | 6.9 | 5.2% | A3/BAA1 | 5.2% | 1.9% to 8.6% |
| US HY Corporate Index | 8.9% | 3.0 | 7.2% | B1/B2 | 7.2% | 5.7% to 8.7% |
Economy
2025 Economic Forecast
| Index | Q4’24 | Q1’25 | Q2’25 | Q3’25 | Q4’25 | Q1’26 |
|---|---|---|---|---|---|---|
| Core PCE (Inflation) | 2.8% | 2.4% | 2.3% | 2.3% | 2.2% | 2.2% |
| GDP | 2.4% | 2.4% | 2.2% | 1.9% | 1.9% | 2.0% |
| Unemployment | 4.2% | 4.3% | 4.3% | 4.3% | 4.3% | 4.2% |
| Fed Funds Rate | 4.6% | 4.3% | 4.0% | 3.8% | 3.7% | 3.6% |
| 2Yr Treasury | 4.1% | 4.0% | 3.8% | 3.6% | 3.6% | 3.5% |
| 10Yr Treasury | 4.3% | 4.2% | 4.2% | 4.1% | 4.1% | 4.0% |
Summary Chart
Projected Liquid Asset Class Returns Cyclical (7-10 Year Horizon)iv

Recommendations
In conclusion, while forecasting market movements remains fraught with uncertainty, understanding the dynamics of risk premiums, valuation levels, and Federal Reserve policy can provide valuable insights for long-term investors. At Trajan Wealth, we focus on disciplined strategies that account for a wide range of possible outcomes – aiming to help clients confidently navigate changing market conditions.
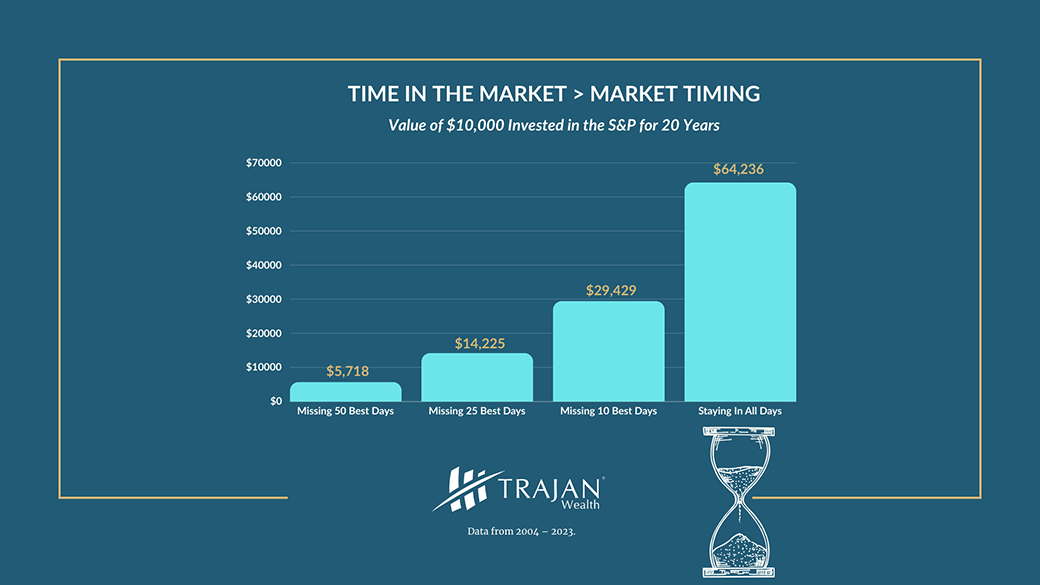
As always, we encourage investors to prioritize long-term goals over short-term market predictions and to remain resilient in the face of evolving economic cycles. As the old adage goes, “Time in the market beats timing the market” and usually delivers superior results. See chart below.v

Questions? For help reviewing your portfolios and making any necessary changes, please get in touch with our Portfolio Management Group at 1 (800) 799-3320.

Udayan Mitra, CFA
Udayan is Trajan Wealth's CIO with over two decades of experience in the investment management industry. He earned a Bachelor of Science degree in Economics from the London School of Economics and an MBA in Finance from Rice University.
*All figures are hypothetical and do not reflect fees. Past performance is not an indicator of future performance. Your results may vary.
i. Source- Bloomberg, December 16th, 2024.
ii. Source- Bloomberg Estimated, December 16th, 2024.
iii. Source – Bloomberg Analytics 12/13/2024.
iv. Source – Trajan Wealth Analytics
v. Source – Bloomberg, Trajan Wealth estimates.


