There is a broad consensus that the Federal Open Market Committee (FOMC) is at or near a terminal rate for overnight money – the Federal Funds Rate.
With the most recent inflation readings showing clear signs of moderating, the consensus view is that by this time next year policy makers will be lowering interest rates and what has been a market headwind since late 2022 will once again become a tailwind. While that scenario may play out, there are some indicators that would suggest the Fed’s war on inflation is not over and there will be additional battles to be fought.
The Personal Consumption Expenditure (PCE) Deflator:
The Federal Reserve’s preferred measure of inflation is the Personal Consumption Expenditure (PCE) Deflator. The index is a chain weighted index which means that the calculations are weighted by the categories which the consumer is currently spending on vs. a fixed weighted index such as the Consumer Price Index (CPI). The chart below shows the year/over/year changes for the PCE Deflator since 2019. From the financial crisis of 2008-09 up until 2019 the deflator had been running between 1-2%.
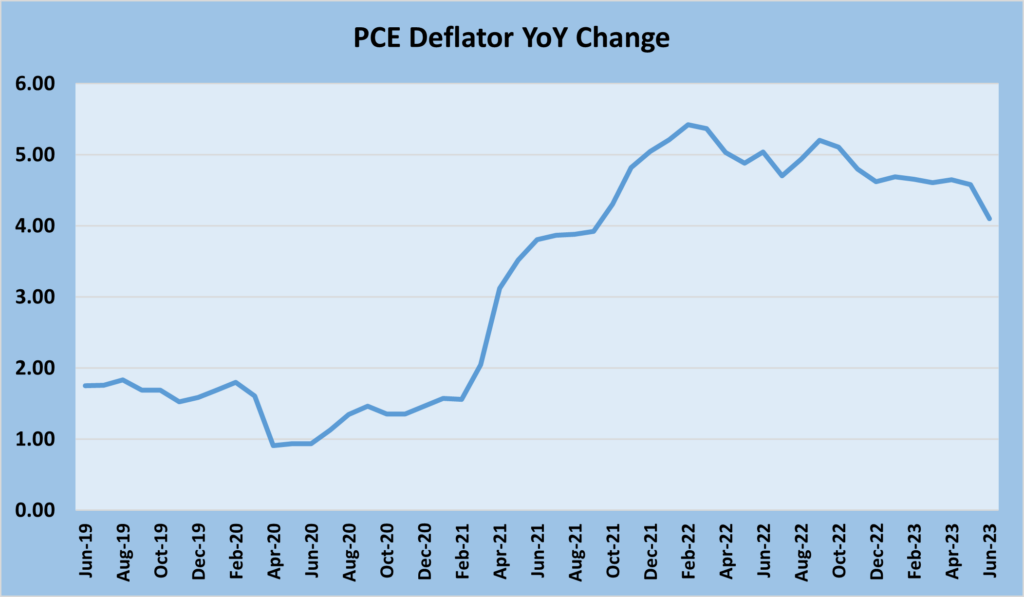
Following the massive injection of liquidity during the pandemic, inflation began rising and the rise was only reversed when the FOMC began raising short-term rates and withdrawing liquidity from the economy. The chart above shows the PCE deflator reached its peak early in 2022 after the FOMC had begun its series of interest hikes which have taken the overnight Fed Funds rate from 0% to over 5%. With inflation receding, several economists and market pundits have declared victory and are calling for the FOMC to begin reducing short-term interest rates. As members of the FOMC have repeatedly stated, they do not believe the inflation fight is over and they still have work to do to bring the rate of inflation back to its 2% target and to ensure that inflation expectations are contained. The traditional way to view long term expectations regarding inflation and interest rates is to view the shape of the treasury yield curve – the relationship between short-term and long-term interest rates. Another measure of inflation is the break-even inflation rates which is determined by the yield relationship between inflation protected bonds and nominal bonds. The chart below shows the shape of the treasury yield curve before the FOMC began raising rates and the current yield curve.
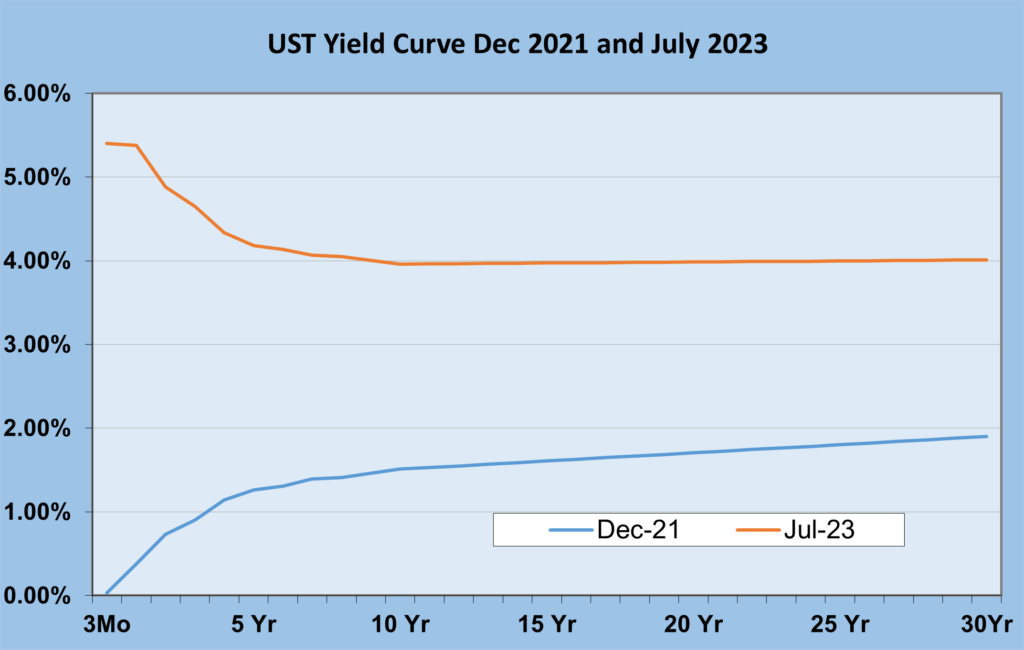
The yield curve inversion is now in its second year and, based on the persistent strength in the labor market, there is a real possibility that the inversion could get larger as the FOMC is forced to raise short-term rates even further. Historically inversions have lasted between one and two years, this one may be around longer based on the persistent strength in the economy and specifically the labor market.
Bond Yields And Returns, Looking Ahead:
The chart below is the break-even inflation rate for 10-year US treasuries. This rate is the yield differential between nominal treasuries and inflation protected treasuries with 10-year maturities.
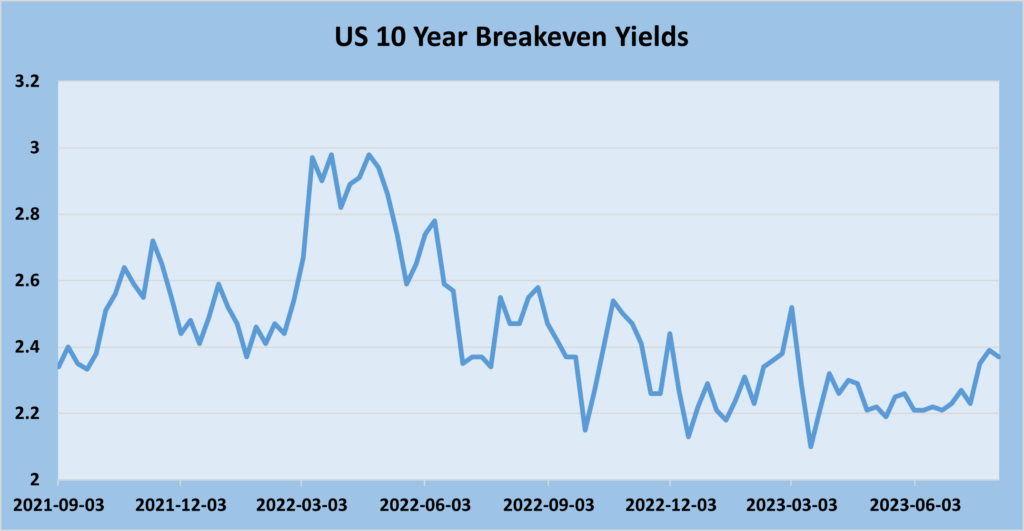
What the above chart shows is that breakeven inflation rates reached a peak around the same time that the major inflation readings did. It’s not surprising that the two indicators reached a peak around the same time and that they have been trending down since that time. The other thing the chart above shows is that while inflation expectations have come down, they have yet to return to a level below the Federal Reserve’s 2% target. In addition, over the past several months, the break evens have been trending higher, something policy makers don’t want to see. What this all means is that investors should expect to see bond yields remain higher than expected and for a longer period of time than.
