Investment Philosophy
Our Guiding Principle
“To preserve and sustainably grow investor capital by maximizing risk-adjusted returns across a diverse set of product lines.”
Definitions
What We Mean When We Say...
"preserve"
Minimize the possibility of permanent losses in investor capital emanating from corporate defaults, bankruptcies, and overwhelming margin calls caused by excessive leverage.
"Sustainably grow"
Actively mitigate the possibility of permanent losses by having a comprehensive risk-management process that monitors developing risks in individual strategies and takes corrective action when appropriate.
“maximizing risk adjusted returns"
We judge performance (excess/shortfall returns relative to strategy benchmarks) on a risk adjusted as opposed to absolute basis – in industry parlance, we aim to maximize Sharpe and Information Ratios.
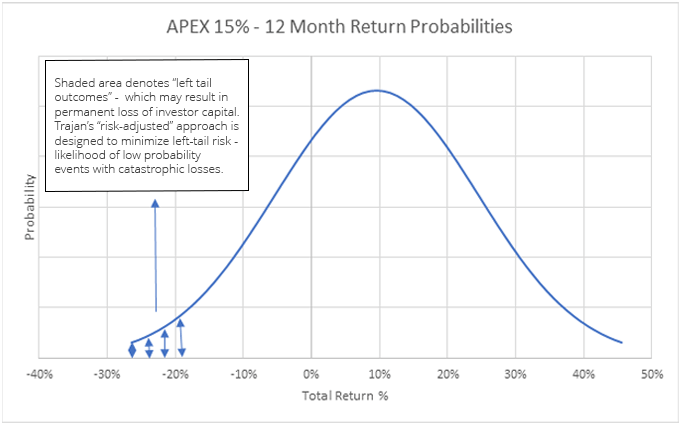
For example, if an equity manager generates a 12% return during a period when the S&P 500 generates 10%, we look at the risk (measured by standard deviation) the manager deployed relative to risk experienced in the S&P 500 over the same time period. If the 200-basis point in excess return was generated deploying and incremental 800-basis points in risk, we may conclude the manager underperformed. Why? His upside capture in is poor, for every 1% of incremental risk the manager is adding 0.25% of incremental return. This may indicate that the manager is taking too much uncompensated risk, which eventually generates excessive “tail risk” (see graph overleaf) in the strategy.
Consider the reverse scenario – in a down market, where is downside capture is poor, meaning for every unit of incremental risk he actually 1.25% of negative performance. By that measure, in a (10)% S&P 500 year, the manager could actually be down (20)%.
“diverse product lines"
Trajan Wealth manages a myriad of investment products covering multiple asset classes and investment styles. The objective is to maximize our capabilities in asset allocation by having unique and uncorrelated returns streams which help dampen overall portfolio volatility. In this respect we offer products across traditional asset classes – public equity, core fixed income, as well as Alternatives – private equity/credit, private real estate, managed futures, and absolute return strategies. Within asset classes, we look for style diversification – contrast “value add” and “opportunistic” in Commercial Real Estate. The common theme underlying all our offerings is the focus of maximizing risk adjusted returns (high Sharpe ratios) and protecting investors from permanent losses of invested capital.
Meet the leadership
Get to know our Chief Investment Officer behind our investment philosophy and all our top leaders at Trajan Wealth.

