It is December and the time of the year that a myriad of practitioners put out their forecasts for the market and the key indicators that drive the overall economy. Despite the unenviable record of market predictions, investment practitioners keep doing it, particularly when industry peers take the lead and put out the first forecasts. As our clients are aware, we at Trajan Wealth are not in the business of predicting the markets; our process, by contrast, involves looking at what is being “priced in” given the level of asset prices – call this a “risk premium,” and the risks to the implied returns given our understanding of the underlying assets. Thus, our outlook should not be interpreted as the rate of return we predict to earn for the next year or two – rather an estimate of the risk premium we expect to earn if the assets are held over the course of a market cycle. Given that there is risk to our “median” estimate, we highlight a range of returns over asset classes that should capture the bulk of probable future outcomes. While the “median” estimate is quantitative and scientific, we take the liberty of a certain amount of judgment – or “art” when postulating the range of outcomes.
Public Equities
With valuations in the US equity markets higher than long-term averages, “risk premiums” or expected returns are low by historical standards – see column marked “Earnings Yield” in the table below. The US Treasury market is pricing inflation to average 2.3% over the next decade, slightly higher than the US Federal Reserve Bank’s 2% target. As such, we expect base case nominal returns to range from 4.9% in the tech-heavy NASDAQ to 9.1% in international equities over the next cycle, with the S&P 500 in the middle at 6.2%. We understand that our “base case” estimate is subject to forecasting error – thus, using an error rate of 25%, our cyclical estimate for nominal returns ranges from 4.7% to 7.8% in the S&P 500 to about 6.8% to 11.4% in international equities – see column marked “Return Range.”
2025 Public Equities Forecast
| Index | YTD 2024 Returnsi | PE Ratioii | Earnings Yield | B/E Inflation | Exp. Return (Full Cycle) | Return Range – using 25% error rate |
|---|---|---|---|---|---|---|
| US Large Cap – S&P 500 | 29.2% | 25.7x | 3.9% | 2.3% | 6.2% | 4.7% to 7.8% |
| US Large Cap – Tech Heavy NASDAQ | 35.3% | 37.8x | 2.6% | 2.3% | 4.9% | 3.7% to 6.1% |
| International Equity – MSCI ex US | 8.9% | 14.7x | 6.8% | 2.3% | 9.1% | 6.8% to 11.4% |
| US Small/Mid Cap – Russell 2500 | 18.1% | 26.6x | 3.8% | 2.3% | 6.1% | 4.6% to 7.6% |
i. Source- Bloomberg, December 16th, 2024.
ii. Source- Bloomberg Estimated, December 16th, 2024.
Fixed Income
The Federal Reserve lowered the Fed Funds rate by 75 basis points or 0.75% in the latter half of 2024 as inflation readings showed signs of stabilizing slightly above the FOMC’s target rate of 2.0%. The market now expects the Fed to cut rates 1 to 2 times between year-end and the middle of 2025, a projection we find increasingly tenuous given the strong overall state of the economy. Fed cuts usually lead to declining rates across the yield curve. However, the FOMC’s 75 basis point rate cuts in 2024 coincided with a rising of 10-year yields as the market started pricing in higher inflationary pressures along with growth. As such, we believe the Fed will have to tread cautiously, as excessive rate cuts might trigger the very same inflationary pressures that the FOMC had to combat in 2022
2025 Fixed Income Forecast
| Index | YTD 2024 Returns | Durationiii | Yield | Avg. Credit Quality | Exp. Return (Full Cycle) | Return Range – using +/- 50bps rate change |
|---|---|---|---|---|---|---|
| Fed Funds Rate | 5.2% | O/N | 4.6% | Benchmark | 4.6% | 4.1% to 5.1% |
| 10Yr US Treasury | 4.4% | 7.9 | 4.4% | Benchmark | 4.4% | 1.1% to 8.4% |
| US Aggregate Bond Index | 2.0% | 6.2 | 4.8% | AA2/AA3 | 4.8% | 1.8% to 7.8% |
| US IG Corporate Index | 3.2% | 6.9 | 5.2% | A3/BAA1 | 5.2% | 1.9% to 8.6% |
| US HY Corporate Index | 8.9% | 3.0 | 7.2% | B1/B2 | 7.2% | 5.7% to 8.7% |
iii. Source – Bloomberg Analytics 12/13/2024.
Economy
As our readers are aware, the Federal Reserve operates under a dual mandate to promote stable prices (i.e., inflation) and conditions for economic growth. The Fed has defined low and stable inflation as a year-over-year change of 2%. In March ‘22, the Fed began raising rates to bring post COVID-19 pandemic inflation back to its 2% target. The speed and magnitude of the rate hikes rendered this one of the most aggressive tightening cycles in almost 4 decades. Having successfully brought inflation under control without sending the economy into recession, we believe the FOMC will operate monetary policy within a tight range to preserve growth without driving inflationary pressures. As such, our forecast for the key economic indicators remains tightly range bound, underpinning our view that asset prices will receive less tailwind from a massive expansion of money supply and liquidity.
2025 Economic Forecast
| Index | Q4’24 | Q1’25 | Q2’25 | Q3’25 | Q4’25 | Q1’26 |
|---|---|---|---|---|---|---|
| Core PCE (Inflation) | 2.8% | 2.4% | 2.3% | 2.3% | 2.2% | 2.2% |
| GDP | 2.4% | 2.4% | 2.2% | 1.9% | 1.9% | 2.0% |
| Unemployment | 4.2% | 4.3% | 4.3% | 4.3% | 4.3% | 4.2% |
| Fed Funds Rate | 4.6% | 4.3% | 4.0% | 3.8% | 3.7% | 3.6% |
| 2Yr Treasury | 4.1% | 4.0% | 3.8% | 3.6% | 3.6% | 3.5% |
| 10Yr Treasury | 4.3% | 4.2% | 4.2% | 4.1% | 4.1% | 4.0% |
Summary Chart
Projected Liquid Asset Class Returns Cyclical
(7-10 Year Horizon)iv
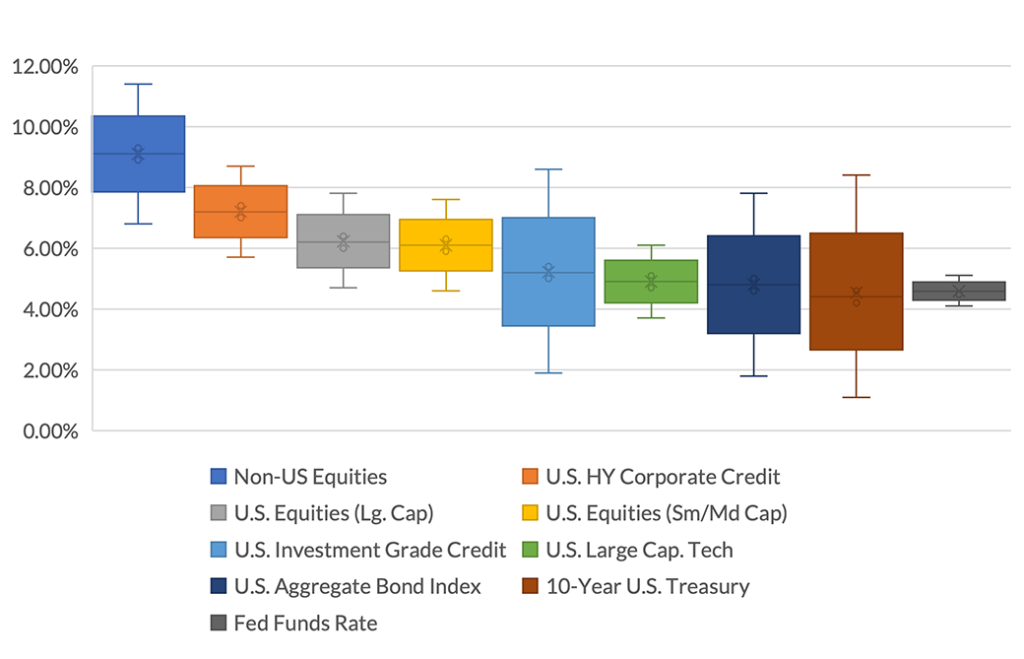
iv. Source – Trajan Wealth Analytics.
Recommendations
In conclusion, while forecasting market movements remains fraught with uncertainty, understanding the dynamics of risk premiums, valuation levels, and Federal Reserve policy can provide valuable insights for long-term investors. At Trajan Wealth, we focus on disciplined strategies that account for a wide range of possible outcomes – aiming to help clients confidently navigate changing market conditions.
As always, we encourage investors to prioritize long-term goals over short-term market predictions and to remain resilient in the face of evolving economic cycles. As the old adage goes, “Time in the market beats timing the market” and usually delivers superior results. See chart below.v
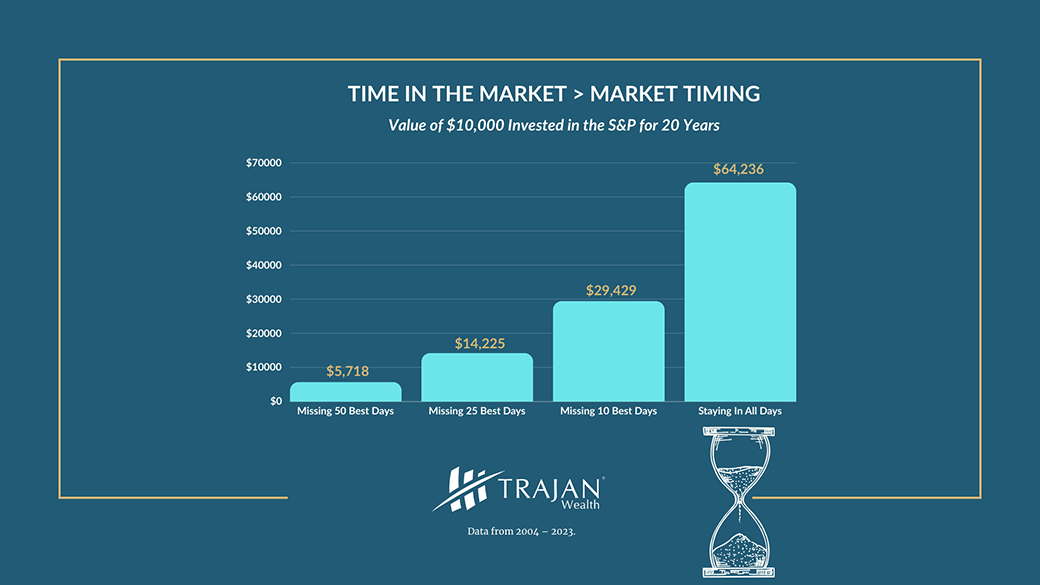 v. Source – Bloomberg, Trajan Wealth estimates.
*All figures are hypothetical and do not reflect fees. Past performance is not an indicator of future performance. Your results may vary.*
