“The true investor welcomes volatility… a wildly fluctuating market means that irrationally low prices will periodically be attached to solid businesses.”
~ Warren Buffett
The Return of Volatility

Fig. 1: Bloomberg – Implied Volatility on 2-year options on the 10-year US Swap Rate
The Federal Reserve Bank’s Open Market Committee (“FOMC”) raised the benchmark overnight Fed Funds rate by 50 basis points to 1.00% during the May 2022 FOMC meeting, after commencing its monetary adjustment process in March. Going forward, the futures market is pricing a 2.75% to 3.00% Fed funds rate by January 2023, implying continuing rate increases at the remaining five FOMC meetings between June and December. As of now, there is near-certain probability of an additional 50 basis points rate hike at the June FOMC meeting and a combination of 50 and 25 basis point rate hikes at the remaining four FOMC meetings in July, September, November, and December.
Meanwhile, yield on the more important 10-year US Treasury note breached 3.0% in early May, pushing the conventional 30-year mortgage rate close to 5.50%. Spikes in mortgage rates reduce home affordability while curtailing the demand for a whole array of durable goods including furniture and appliances. Also, higher borrowing costs raise the threshold for corporate investments, ultimately generating a contractionary macroeconomic effect. However, despite these growth-reducing factors, yields on bonds are rising sharply since inflationary pressures continue to be felt from supply disruptions in commodities, lockdowns at certain large manufacturing hubs, and wage pressure emanating from a tight US labor market. As such, there is a high degree of uncertainty as to the Fed’s ultimate “neutral” rate in monetary policy – “neutral” being defined as a rate that balances favorable conditions for economic growth/employment with stable prices This uncertainty is being priced in the bond market (see figure 1.) – implied (market priced) volatility on the 10-year bank lending rate is now at 108 basis points vs.
its long-term average of 69 basis points. These elevated levels in interest rate volatility were last seen in 2011, a full decade from where we are today. At Trajan Wealth, we believe interest rate volatility will remain elevated as the FOMC navigates its way to a neutral monetary policy and achieves its long-term inflation target of between 2.0% and 2.5%.
Equity Volatility
Meanwhile, taking its cue from the interest rate market, US equity market volatility as measured by the VIX (implied volatility on S&P 500 options, see figure 2.) has also trended upwards since the Fed announced its intention to tighten monetary policy last November. As borrowing costs rise, equity valuations fall as futures cash earnings are discounted at higher rates. The sharp rise in bond yields over the past 2 months have caused widespread disarray in broad equity market indexes – at the time of writing, the S&P 500 is down 12.99% YTD, while the tech-heavy NASDAQ is down 21.27%, officially entering “bear market” territory. This is despite appreciable revenue and earnings growth at bellwether technology companies like Apple (AAPL) and Microsoft (MSFT), outperformance versus analyst expectations at Meta Platforms (FB), and performance in line with expectations at Alphabet Inc. (GOOGL). This indicates that uncertainty over the magnitude of increases in interest rates going forward is more than offsetting the positive effects of stable to improving financial performance at many of the large mega-cap tech companies that constitute a significant part of broad US equity indexes. Once again, we at Trajan Wealth expect equity volatility to continue trending upwards, reflecting the same uncertainty over future interest rates as we are experiencing in the fixed income markets.

Fig. 2: Bloomberg – VIX, implied volatility on near dated S&P 500 options
(Accelerating) Inflation:
Putting the Genie Back Into The Bottle

Fig. 3: Bloomberg – Personal Consumption Expenditure Deflator
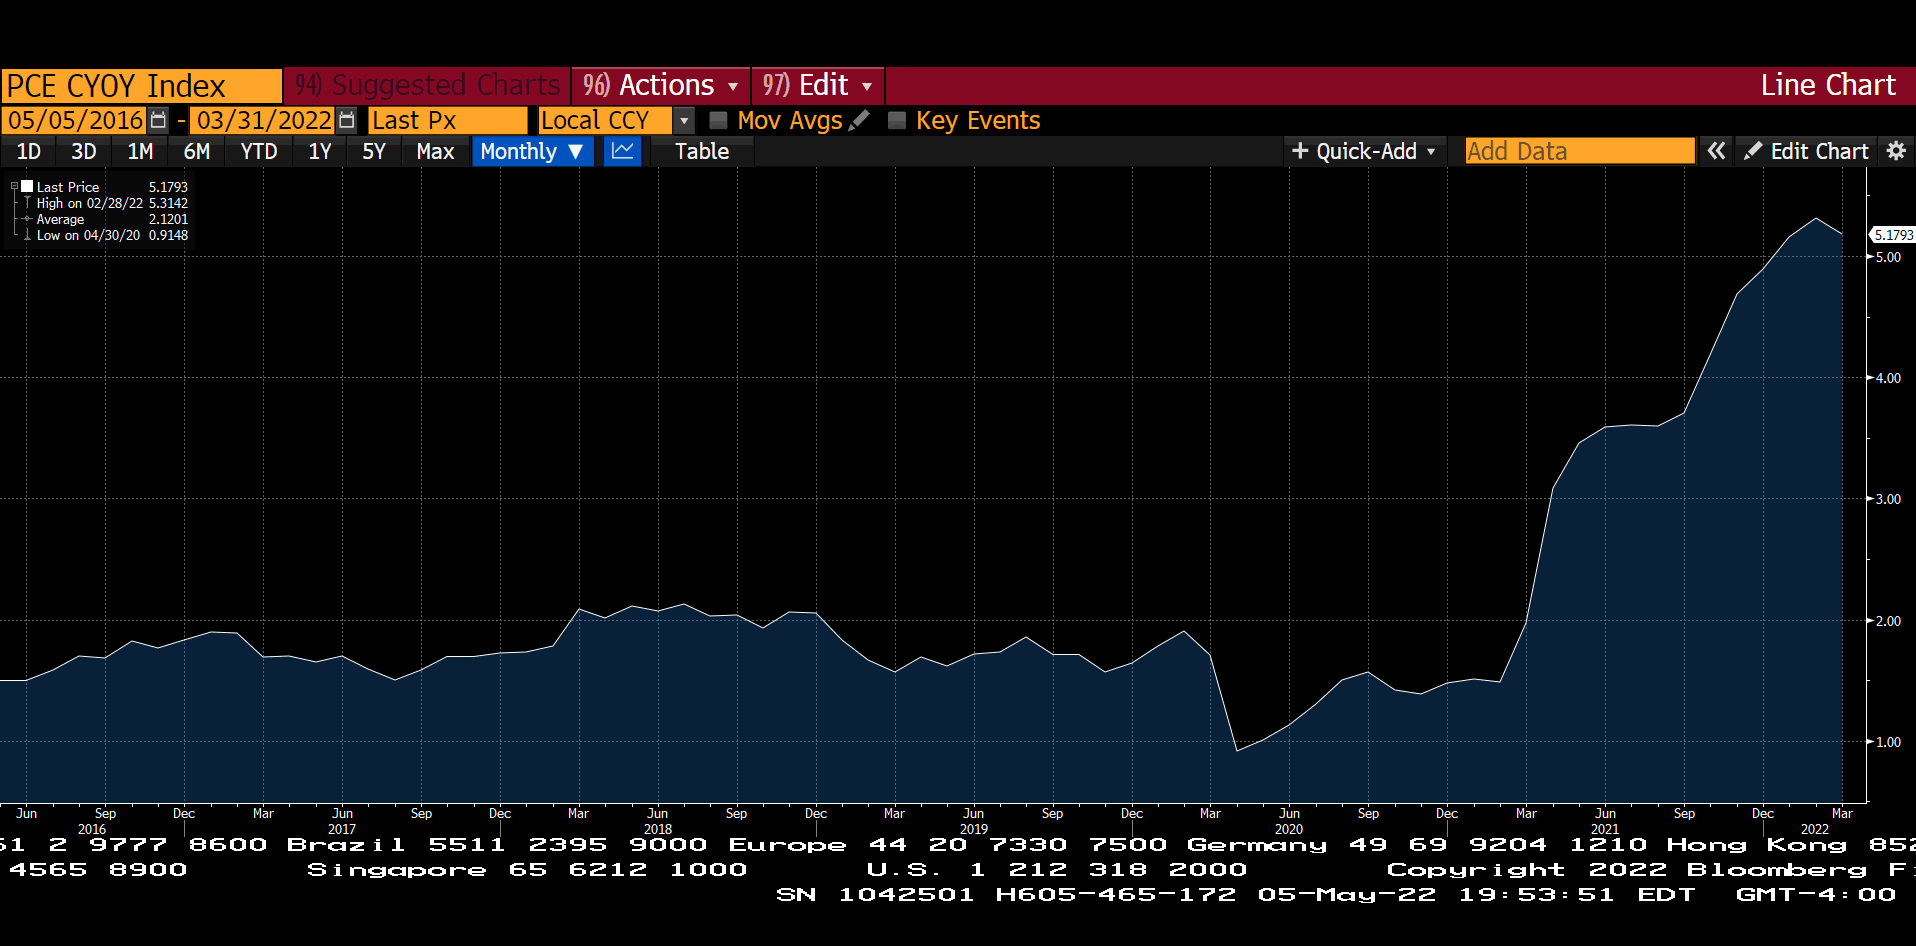
The above chart (figure 3.) shows both what the Fed is trying to control and the extent of its problem. Since the Summer of 2021, coinciding with the gradual easing of Covid-19 lockdowns, the supply of both commodities and many critical finished goods (for, example semi-conductors) struggled to keep up with strong pent-up demand, itself augmented by cheap credit and generous stimulus-related income. The Fed’s preferred gauge of inflation, the Personal Consumption Expenditure Deflator (“PCE”) accelerated sharply from below 1% during the Covid lockdowns to over 5% as the lockdowns ended. The trend line looks decidedly upwards as rising prices have now factored into wages in a historically tight labor market. Accelerating wages is the rocket fuel for sustained inflation, as employers attempt to increase prices to offset costs, which in turn generates higher wage demands. To preempt this spiraling transmission mechanism, the Fed must increase rates to raise the cost of credit and thereby dampen demand. Arguably, the Fed is “behind the curve” in this process, but with the PCE Deflator at about 300 basis points above what is viewed as the Fed’s implicit target, it is difficult to argue that inflation has, or indeed will, get out of hand. For perspective, the PCE Deflator was over 10% in the mid-1970s and just shy of 10% in the early 1980s.
Market Valuations – An Opportunity
Having affirmed our confidence in the Fed’s ability to ultimately get inflation under control with relatively moderate preemptive steps (contrast today’s Fed policy adjustments with the cold turkey approach of Fed Chairman Paul Volcker in the early 1980s), we completely understand our clients’ anxiety with the current gyrations in the equity and fixed income markets. It is never comforting to see diminutions in portfolio values, much less having to plan for lesser assets to meet future liabilities. However, while spikes in market volatility can be unnerving, for disciplined long-term investors, volatility can also lead to opportunity. Volatility itself refers to highly fluctuating prices for a wide universe of assets. During periods of downward volatility – market gyrations resulting in lower prices, it is conceivable that certain solid businesses that otherwise have strong and stable financial performance can be acquired at extremely compelling prices. The current spike in equity market volatility has led to cheaper valuations across the board in US companies; many of which have experienced no significant downdrift in both operating and financial results. For the patient and disciplined investor, many stocks may represent compelling value as the same anticipated future cash flows can be acquired at cheaper prices.

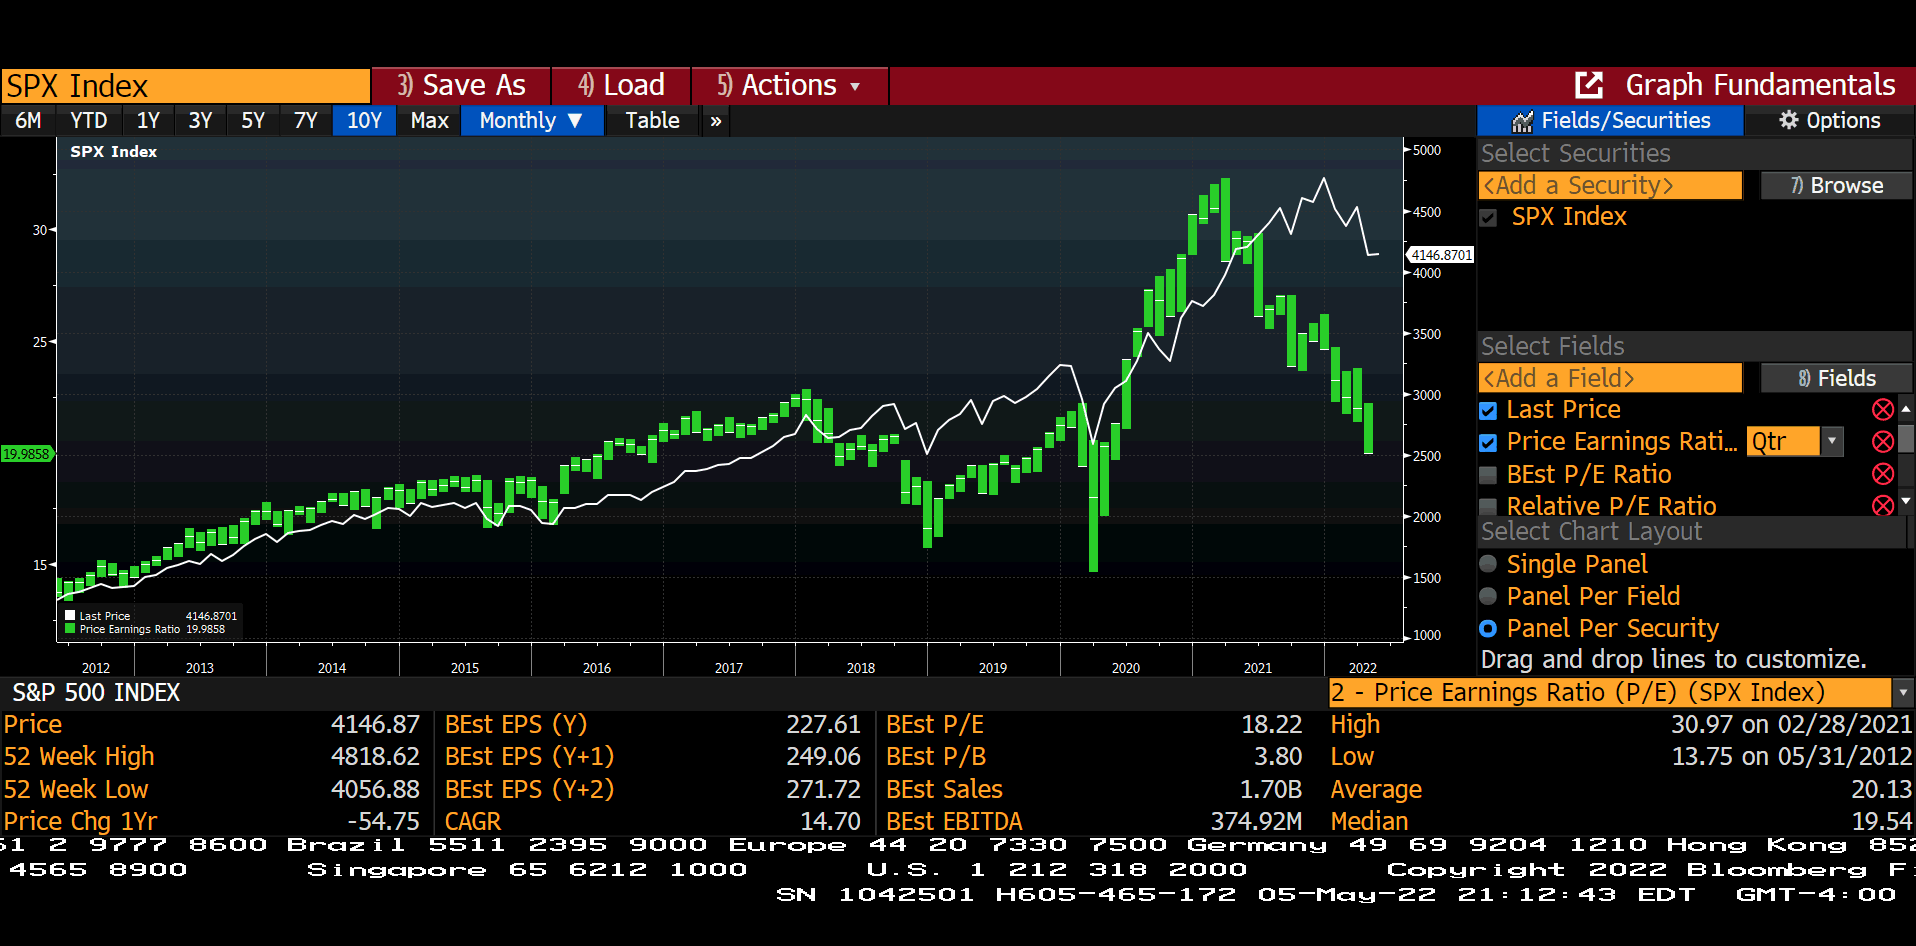
Fig. 4: Bloomberg – S&P Valuation (P/E) multiples vs. Index Level (time series)
The above chart– figure 4. illustrates the recent diminution of businesses valuation across stocks in the S&P 500 index. In the first quarter of 2021, the S&P 500 composite of large cap US companies was trading at 31x (“x” being multiples) weighted average earnings, against its 10-year average of about 20x. Currently, the index is trading at a little over 18x projected full-year 2022 earnings. To be sure, interest rates (the discounting mechanism) have increased; 10-year rates are about 120 basis points higher, but earnings have continued to grow in line with the S&P 500’s long-term YOY average of 6.5%. Therefore, the same businesses are considerably cheaper now, and many of them will continue their growth momentum going forward through innovation, technology, and sustained productivity. The challenge for active investment managers is to identify the best prospects.
Recommendations…
We continue to advocate active participation in the financial markets and urge our clients to stay disciplined and focused on their long-term financial goals. As investment practitioners, we also advocate diversification across asset classes in line with individual risk-tolerance thresholds. However, within asset classes, rather than broad diversification across individual issuers, we feel a certain quality bias is appropriate given tightening fiscal and monetary policy, and the implications of high leverage in the global financial system. We recommend being “quality-focused” and weighting investments towards companies with well-capitalized balance sheets. We also recommend, where appropriate, investments in “real assets” (for example, sectors of commercial real estate) through prudently leveraged structures and investments in alternative asset classes that demonstrate high diversification characteristics to broad equity and credit market risk.
UDAYAN MITRA, CFA
Trajan Wealth Chief Investment Officer
