“The investor of today does not profit from yesterday’s growth.”
~ Warren Buffett
The Fed’s Balance Sheet & Stock Market Returns
Allow me to start this month’s newsletter by borrowing a quote from legendary investor Warren Buffet – “The investor of today does not profit from yesterday’s growth.” The rationale for doing so is that from the end of the Financial Crisis of 2008/09, up until the commencement of the Federal Reserve Bank’s tightening cycle, the S&P 500 had an average annual total return of a staggering 16.6%. Over the same period of time, assets in the Federal Reserve Bank’s balance sheet (the clearest measure of the growth in money supply since the Fed buys assets bought by increasing the monetary base) grew from under $1 trillion to a high of about $9 trillion, an annual growth rate of an astounding 18.4%. The correlation between the two – see charts 1 & 2 are striking.
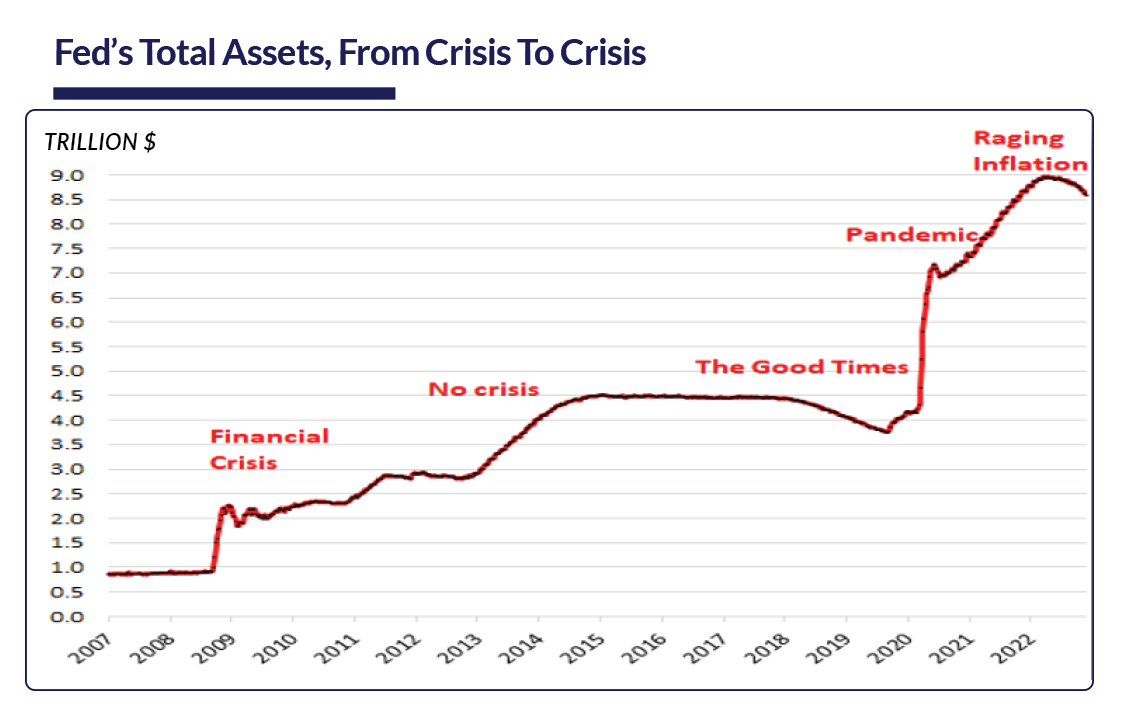
Chart 1. Source: Fed H.4.1 Balance sheet; Wolfstreet.com
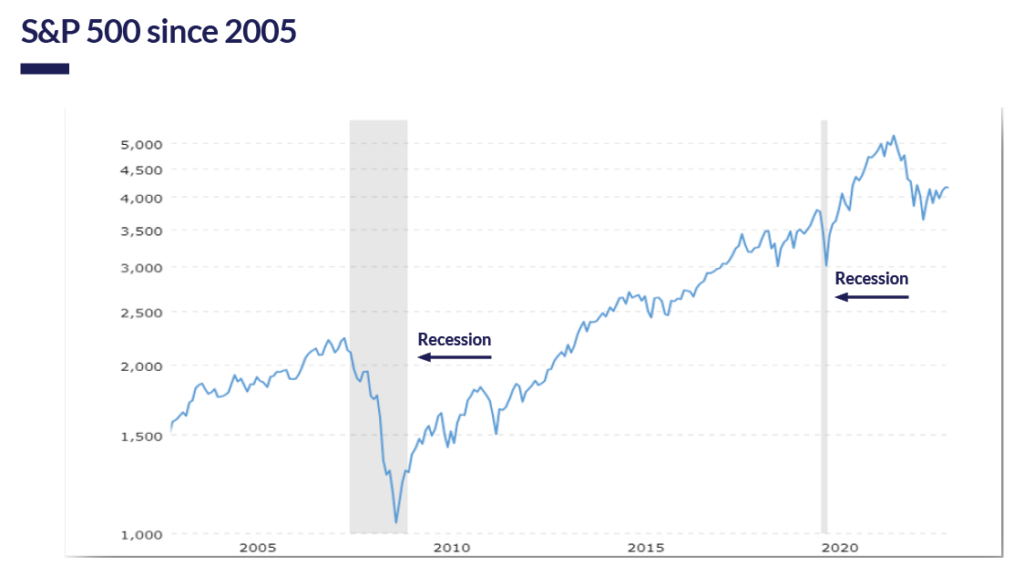
Chart 2
| Metric | CAGR 3/31/2009 to 3/31/2022 |
|---|---|
| US Federal Reserve Bank’s Assets on Balance Sheet | 18.4% |
| S&P 500 Total Return | 16.6% |
At the present time, the Federal Reserve Bank is in the process of selling assets from its balance sheet, thereby reducing money supply and contracting the monetary base. Chairman Powell indicated that the Fed’s pace of unwinding assets is targeted at about $90 to $95 billion a month, averaging about $1.1 to$1.2 trillion per year. Therefore, it will take seven years to reach an asset level of below $1.0 trillion on the Fed’s balance sheet and reach a level commensurate to what it was before the onset of the Financial Crisis of 2008/09. With tightening money supply and higher interest rates, it is unrealistic to expect equity market returns higher than the growth in corporate profits. The long-term growth rate of corporate profits among companies in the S&P 500 is 6.5%. Thus, we expect returns to average in the 6%-8% range over the course of the next 7–10-year cycle, the upside of 8% reflecting the value accretion possibilities of new, evolving technologies.
While this may be a bitter pill for many of our clients to swallow, our outlook is broadly in line with long-term US Equity performance – the S&P 500 has returned between 8.5% to 10.5% since inception in 1957, the range reflecting different assumptions on dividend reinvestment (cash vs. reinvestment into the index). Accordingly, it is safe to say that the returns experienced in US equities in the period 2009 through early 2022 were an aberration to long-term trends; the tailwinds largely driven by cheap money and extraordinarily high levels of money supply. There was always going to be a day of reckoning with expansive monetary policy, and we are now witnessing the side effects with persistingly high inflation. As such, we do not expect the Fed to be accommodative any time soon.
The Ongoing Credit Market Saga
The Federal Reserve Bank’s Open Market Committee (“FOMC”) raised the target Fed Funds rate by 0.25% at the March 22nd FOMC meeting bringing the target overnight rate to between 4.75% and 5.00%.
Chart 3. Source: B of A Global Research
The rate hike occurred amidst the collapse and subsequent government/central bank-engineered depositor bailouts of three banks – two here in the US and one in Europe. Silicon Valley Bank and Signature Bank could no longer control depositor outflows as yields on assets on their balance sheets (long-dated US Treasury and Mortgage-Backed Securities issued before 2022) fell well below interest offered currently on short-term money market instruments such as newly issued 6-month US Treasury Bills and high quality, short-dated US Corporate Commercial Paper. Treasury Bills and Commercial Paper are the main components of prime money market funds. With money market funds offering significantly higher interest than bank savings and checking accounts, both Silicon Valley Bank and Signature Bank faced the classic “bank runs.” To avoid market turbulence, the US Treasury, along with the FDIC and the Federal Reserve Bank, extended full FDIC insurance guarantees to depositors (including previously uninsured balances) and injected liquidity into the two banks, while administering a “managed” bankruptcy of the bank’s parent holding companies. In Europe, a large global bank, Credit Suisse, faced similar problems from many years of mismanagement. The Swiss government, along with the Swiss monetary authorities, administered similar programs to make depositors whole while engineering a takeover of the bank’s parent company by a rival, UBS AG.
More recently, we witnessed the same phenomenon in Frist Republic Bank (“FRC”), when the same asset-liability mismatch on the balance resulted in similar “bank run” issues. Like with Silicon Valley Bank, the FDIC stepped in to ensure all outstanding uninsured deposits and together with the US Treasury, and the Reserve Bank, engineered the purchase of FRC by JP Morgan.
The reason why many banks are currently under duress is that their assets (typically loans and marketable fixed-income securities) are typically longer dated than their liabilities – interest obligations to depositors. Banks such as Silicon Valley Bank, First Republic Bank, and Signature Bank had significant mismatches in their assert-liability models over the past decade as short-term rates (the basis for interest on checking/savings accounts) were near zero, while yields on long-term securities (a large component of bank assets), although low by historical standards, offered an attractive spread to short term rates. However, with both long and short-term interest rates up dramatically in 2022, banks faced the squeeze of declining market values in the long-dated fixed income portfolios and the demand for higher returns by depositors. This is an ongoing problem – a recent CNN article revealed an aggregate of $620 billion in unrealized losses in the balance sheets of regional US banks – this number may be receding slightly with the decline in long-term US Treasury rates. However, faced with dilution in bank equity in many regional banks, we expect bank lending standards to tighten and the cost of bank credit to rise.
The Federal Reserve Bank is acutely aware of the banking problem. Yet Chairman Powell has repeatedly reiterated that the primary focus of monetary policy remains the fight to bring down inflation from over 5% to the long-term target of 2%. With a tightening interest rate policy and tighter credit standards going forward, the bond market is pricing in a significant economic slowdown. As the Fed raises short-term rates, bond investors are actually buying up longer-dated bonds in the belief that the Fed will have to reverse course as growth contracts and unemployment rises.
Recommendations
We continue to advocate an elevated level of diversification across asset classes and develop specific asset allocation perimeters that cater to individual risk-tolerance thresholds. In the context of higher yields and the prospect of slower economic growth, Fixed Income assets should command a higher weighting in most portfolios. Within asset classes, Trajan Wealth’s investment team is maintaining its quality bias. We also believe that non-traditional asset classes – “real assets” such as real estate merit consideration given persisting inflationary pressures. We also expect elevated levels of market volatility going forward, if only due to rapidly rising financing costs that may adversely affect economic growth and corporate profits. As such, absolute return strategies – trend following and equity/credit market dispersion, which benefits from volatility may be appropriate for certain investors in an overall asset allocation. We continuously look for these unique sources of returns for our clients and will make recommendations as we develop additional strategies and update our asset allocation models.
