“If you are in banking and lending, surprise outcomes are likely to be negative for you.”
~ Nassim Nicholas Taleb, Financial Analyst, Investor, Author
Market Returns & Outlook
The financial markets took a breather in August, with stocks and bonds posting negative returns for the month (see table below). Year to date returns across major equity indexes, however, range from about 9.2% in the International Equity sector to a superlative ~34.9% in the tech heavy NASDAQ, substantially outperforming historical annual averages (note, we are only 8 months into 2023) spanning multiple decades. The US bond market meanwhile posted a YTD return of about 1.4% at the end of July, an appreciable turnaround from the horrendous results of 2022, during which the asset class returned a grim (13.0)%.
| Index | YTD TR (%) | August 2023 |
|---|---|---|
| US Large Cap – S&P 500 | 18.72% | (1.59)% |
| US Large Cap – Tech Heavy NASDAQ | 34.89% | (2.05)% |
| International Equity – MSACWI ex US | 9.23% | (4.50)% |
| US Small/Mid Cap – Russell 2500 | 9.70% | (3.93)% |
| Bloomberg Aggregate Intermediate Bond Index | 1.37% | (0.64)% |
Our outlook for future equity and bond returns over the next cycle merits a certain level of caution. While we are not in the business of predicting future returns, our valuation and risk-based approach conditions us to make an honest assessment of current asset values, and the outlook for the two main components that drive changes in asset values, namely growth and interest rates.
In assessing the future trajectory of growth and interest rates, we are witnessing some sobering developments. Over the course of the past weeks, it has become clear that the Chinese economy is in the front end of a serious real estate crisis. The largest commercial real estate developers, China Evergrande and Country Garden Holdings are essentially insolvent – China Evergrande has formally filed for bankruptcy, and the entire commercial real estate sector in the country is burdened by overcapacity and rising vacancies driven by the lack of homeowner and commercial lease demand. Despite economic data from China being unreliable, western financial institutions estimate that the real estate sector accounts for a 30%-33% of the overall Chinese economy. The malaise is gradually affecting the credit markets with loan defaults rising and consumer demand for credit contracting sharply. With businesses unable or unwilling to borrow, youth unemployment in urban areas according to Wall Street Journal reports stands at a staggering 20%.
The future trajectory of the Chinese economy is in part dependent on policy choices, but with the nation’s current Debt/GDP ratio approaching 280% according to Bloomberg reports, there are limited policy levers available to the Chinese government to stimulate commercial activity. Given the size of the Chinese economy further weakness could spill over to the world markets adding to already slowing growth.
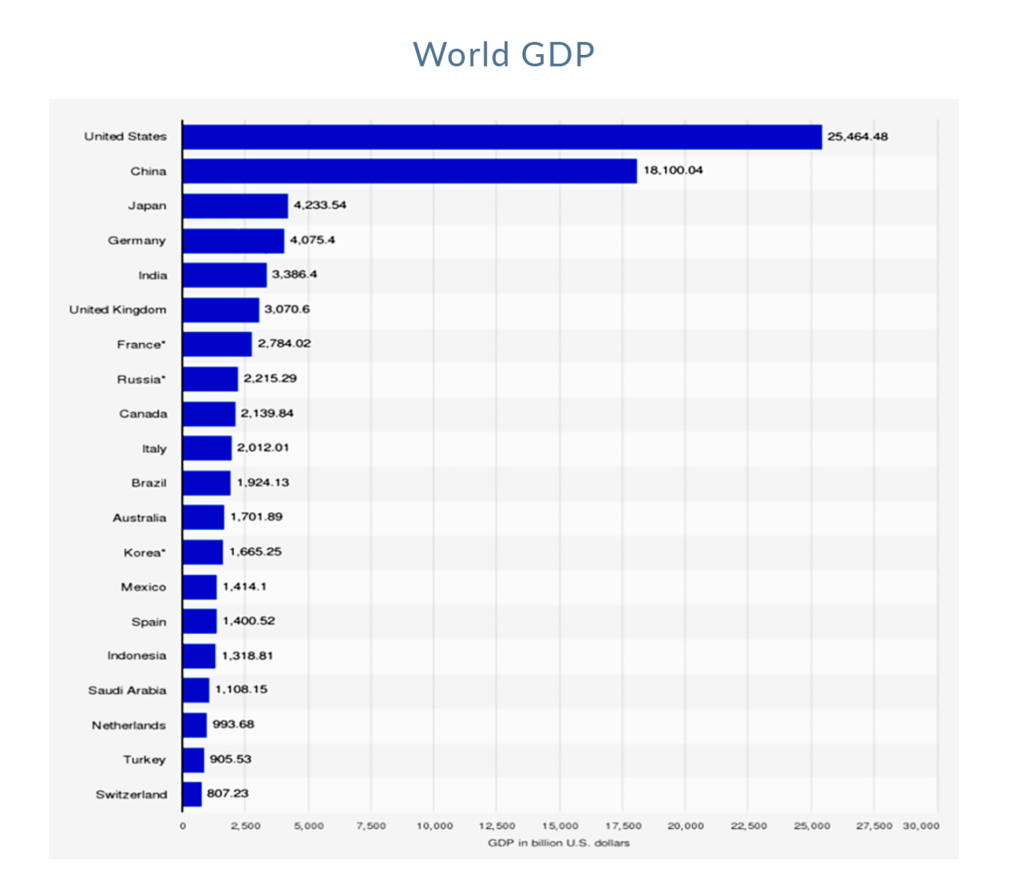
Chart 1. Source: IMF
Why is China that important? They say that when the United States sneezes (economically speaking), the world catches a cold. From the above chart, the reason for this phenomenon is obvious. Of the world’s $100 billion in annual GDP, the US accounts for 25%, a quarter of the world’s overall economy. However, China accounts for about 18% of Global GDP, a share greater than that of Japan, Germany, India, and the United Kingdom combined. Moreover, China is at the center of the world’s manufacturing supply chains and a big importer of commodities including oil and gas, steel, and copper as well as agricultural products. Accordingly, a financial meltdown or a sharp slowdown in the Chinese economy will inevitably result in economic turbulence in many parts of the world, with obvious ramifications for global GDP growth, aggregate corporate revenues, and aggregate corporate profits. We see this as a significant risk factor in our outlook for global equity market performance.
Indeed, turmoil in China, among other factors such as growing global indebtedness has led the International Monetary fund (“IMF”) to paint a tepid forecast for global GDP growth for the next five years through the end of 2028. – see chart 1. From the sharp rebound post Covid-19, the IMF projects that global growth will decelerate sharply and settle at a sub-par ~3.5%. Should this be the trajectory in global GDP growth, the outlook for overall corporate earnings growth will be similarly subdued.
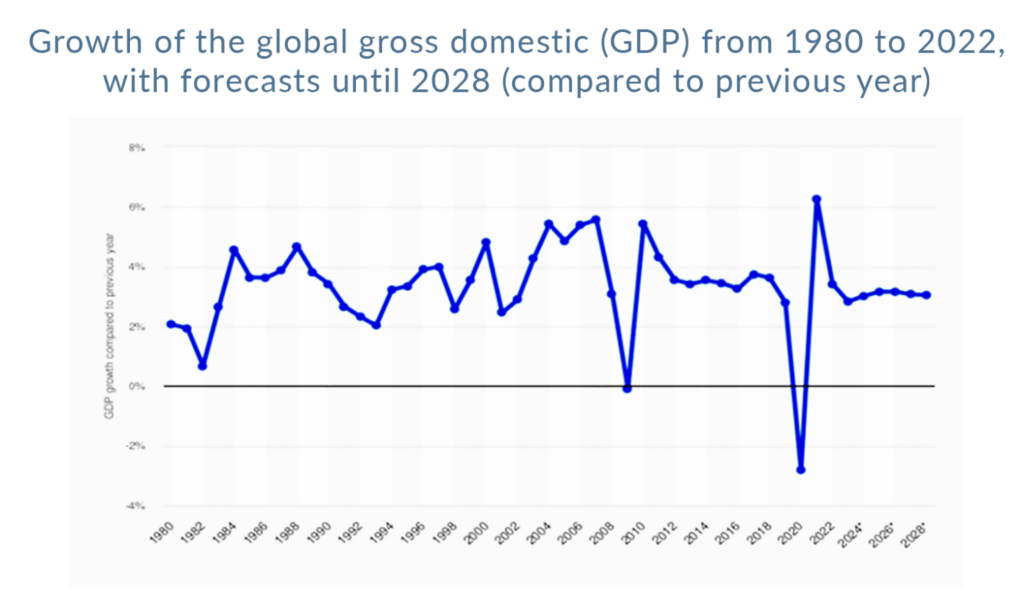
Chart 2. Source: IMF
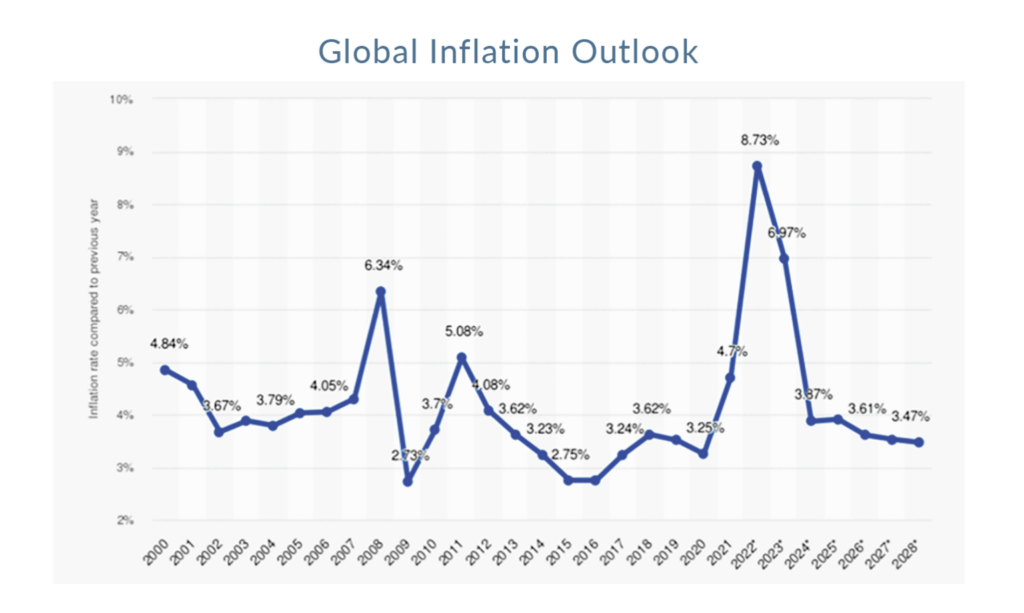
Chart 3. Source: IMF
On a more sanguine note, the IMF also projects global inflation stabilizing over the next five years to levels in line with the world’s long-term average of about 3.5%. This means that intermediate and long-term interest rates (five through thirty maturities) should stabilize at near current levels, generating positive real (inflation adjusted) returns for fixed income investors. However, we continue to see tighter monetary policy going forward as global central banks reduce the size of their balance sheets and thereby tighten credit standards. The US Federal may ease short-term rates modestly, but intermediate rates (the backdrop for equity valuation) will likely remain in the 4% to 5% range, provided little, if any back lift of equity multiple expansion.
Private Assets
With the outlook for growth and earnings looking tempered going forward, we at Trajan Wealth believe that we can significantly enrich our clients’ investment outcomes by prudently allocating portions of their long-term investment portfolios towards private assets*. As mentioned in last month’s letter, private assets are assets that are not traded in the public markets and include the equity – Private Equity, and debt – Private Credit of private companies, Private Commercial Real Estate, and Private Infrastructure Funds – pools of capital invested in private infrastructure projects, to name a few. Being private assets, these asset classes are significantly illiquid, taking as much as a decade for the return of and the returns on invested capital. However, they tend to command a veritable and persistent illiquidity premium – and since valuation changes only reflect changes in durable changes in earnings and cash flow, they tend to be less volatile than publicly traded assets – absence of momentum trades, short interest or short covering, algorithmic trading and leveraged trades that result in amplifying volatility in publicly traded assets.
Recommendations
We continue to advocate an elevated level of diversification across asset classes and develop specific asset allocation perimeters that cater to individual risk-tolerance thresholds. In the context of higher yields and the prospect of slower economic growth, Fixed Income assets should command a higher weighting in most portfolios. We also believe that non-traditional asset classes – “real assets” such as real estate and infrastructure, as well as private equity and private credit merit consideration given the real portfolio enhancement opportunities as we transition to a potentially lower growth environment. With investors with a long-term investment horizon, the illiquidity premium in private assets is an attractive source of additional returns. The great news is that private assets, once the sole purview of institutional investors, are gradually being democratized with developments in technology and changes in the regulatory environment.
*Investment in private equity may require accreditation.*
