“At all times, in all markets, in all parts of the world, the tiniest change in rates changes the value of every financial asset.”
~ Warren Buffet
Fed Policy, Economy, And Markets
Since the end of the 2nd quarter of 2024, there have been releases of economic data suggesting the pace of growth in the overall US economy may be moderating. Trends in one of the most followed economic releases – the monthly Employment Report, are beginning to show a slowdown in new non-farm job creation, suggesting that the pace of hiring is slowing down – see chart “Change in Non-Farm Payroll” below.
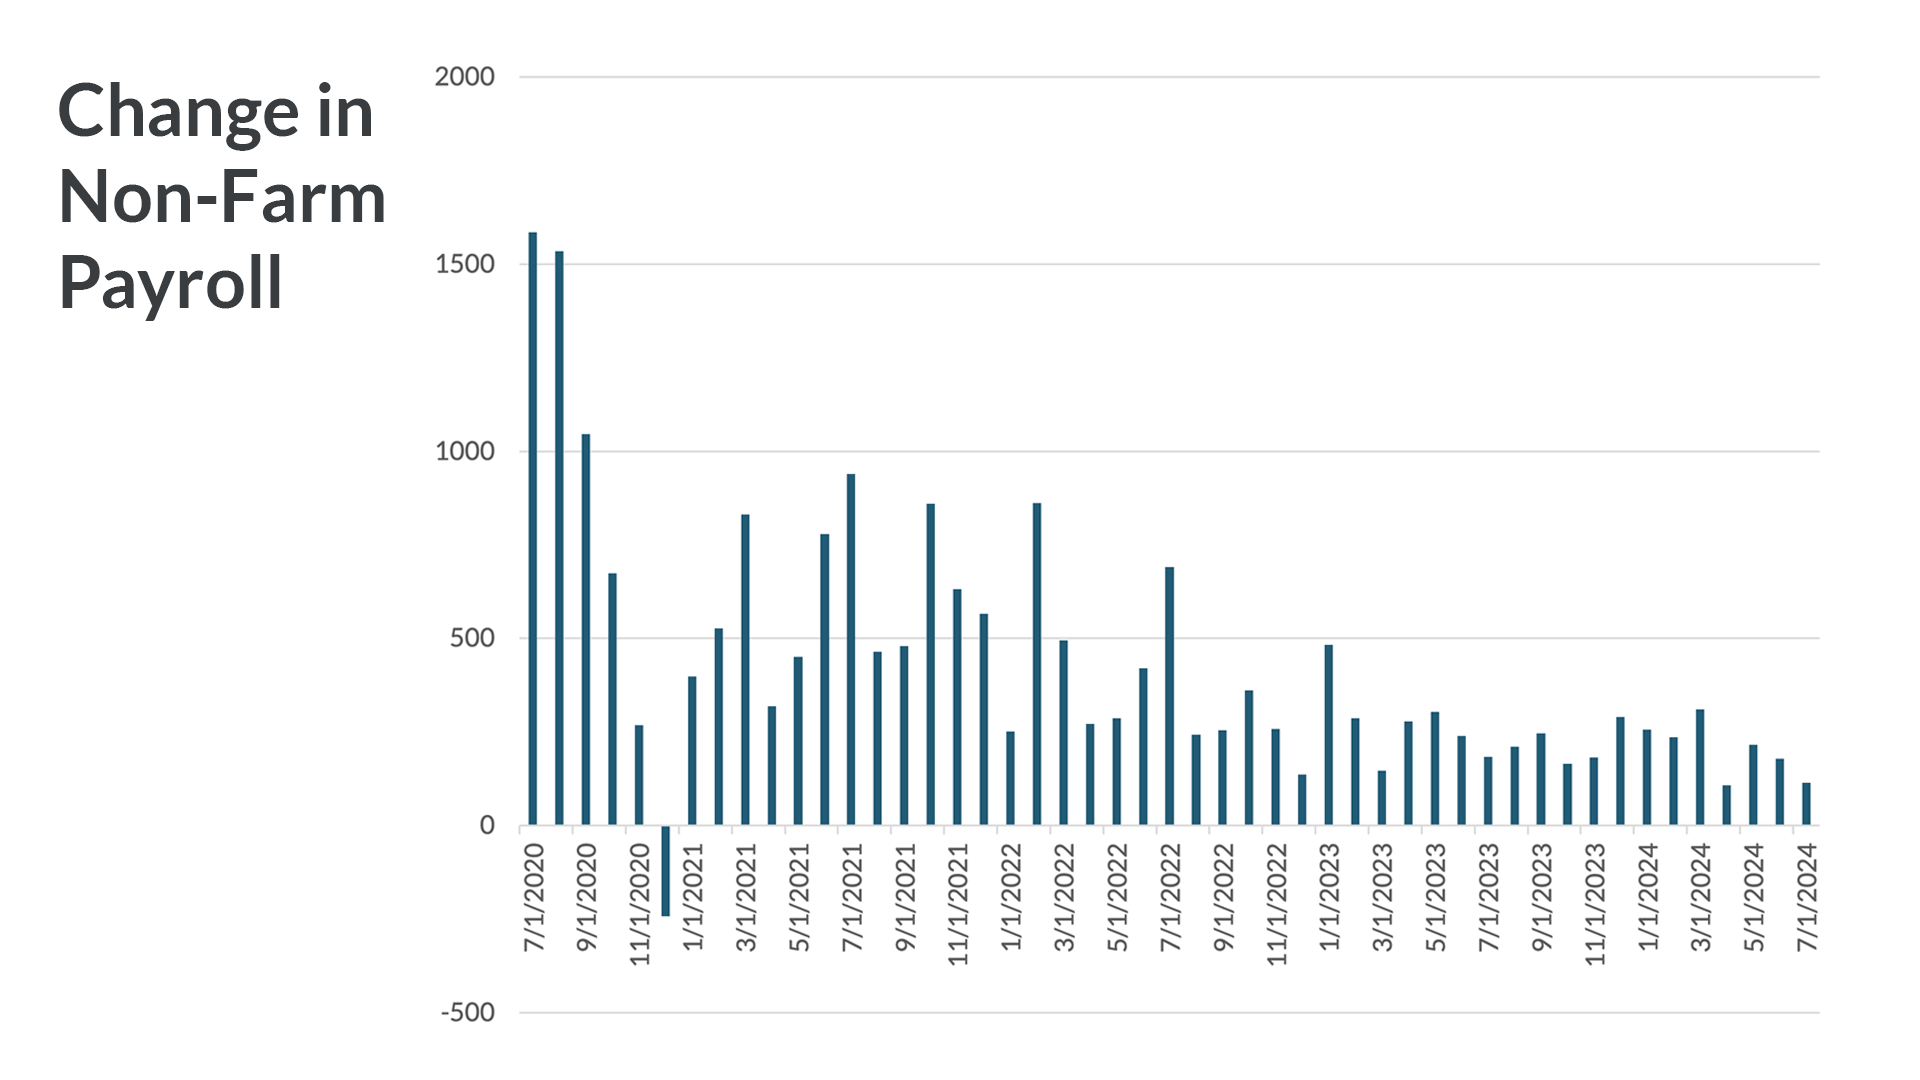
i. Source – Bloomberg
Since consumer spending accounts for two-thirds of US GDP, the slowdown in hiring, paired with moderating inflation, gives the Federal Reserve Bank’s Open Market Committee (“FOMC”) the wherewithal to reduce overnight interest rates as a pre-emption mechanism to avoid a full-fledged contraction in the economy. The fixed income market is now pricing in 200 basis points or 2% in rate cuts over the course of the next 12-months – see chart marked “90 Day Fed Fund Futures”, reflecting the view that the FOMC will do its best to engineer a “soft landing” in the economy and prevent a sharp recession.
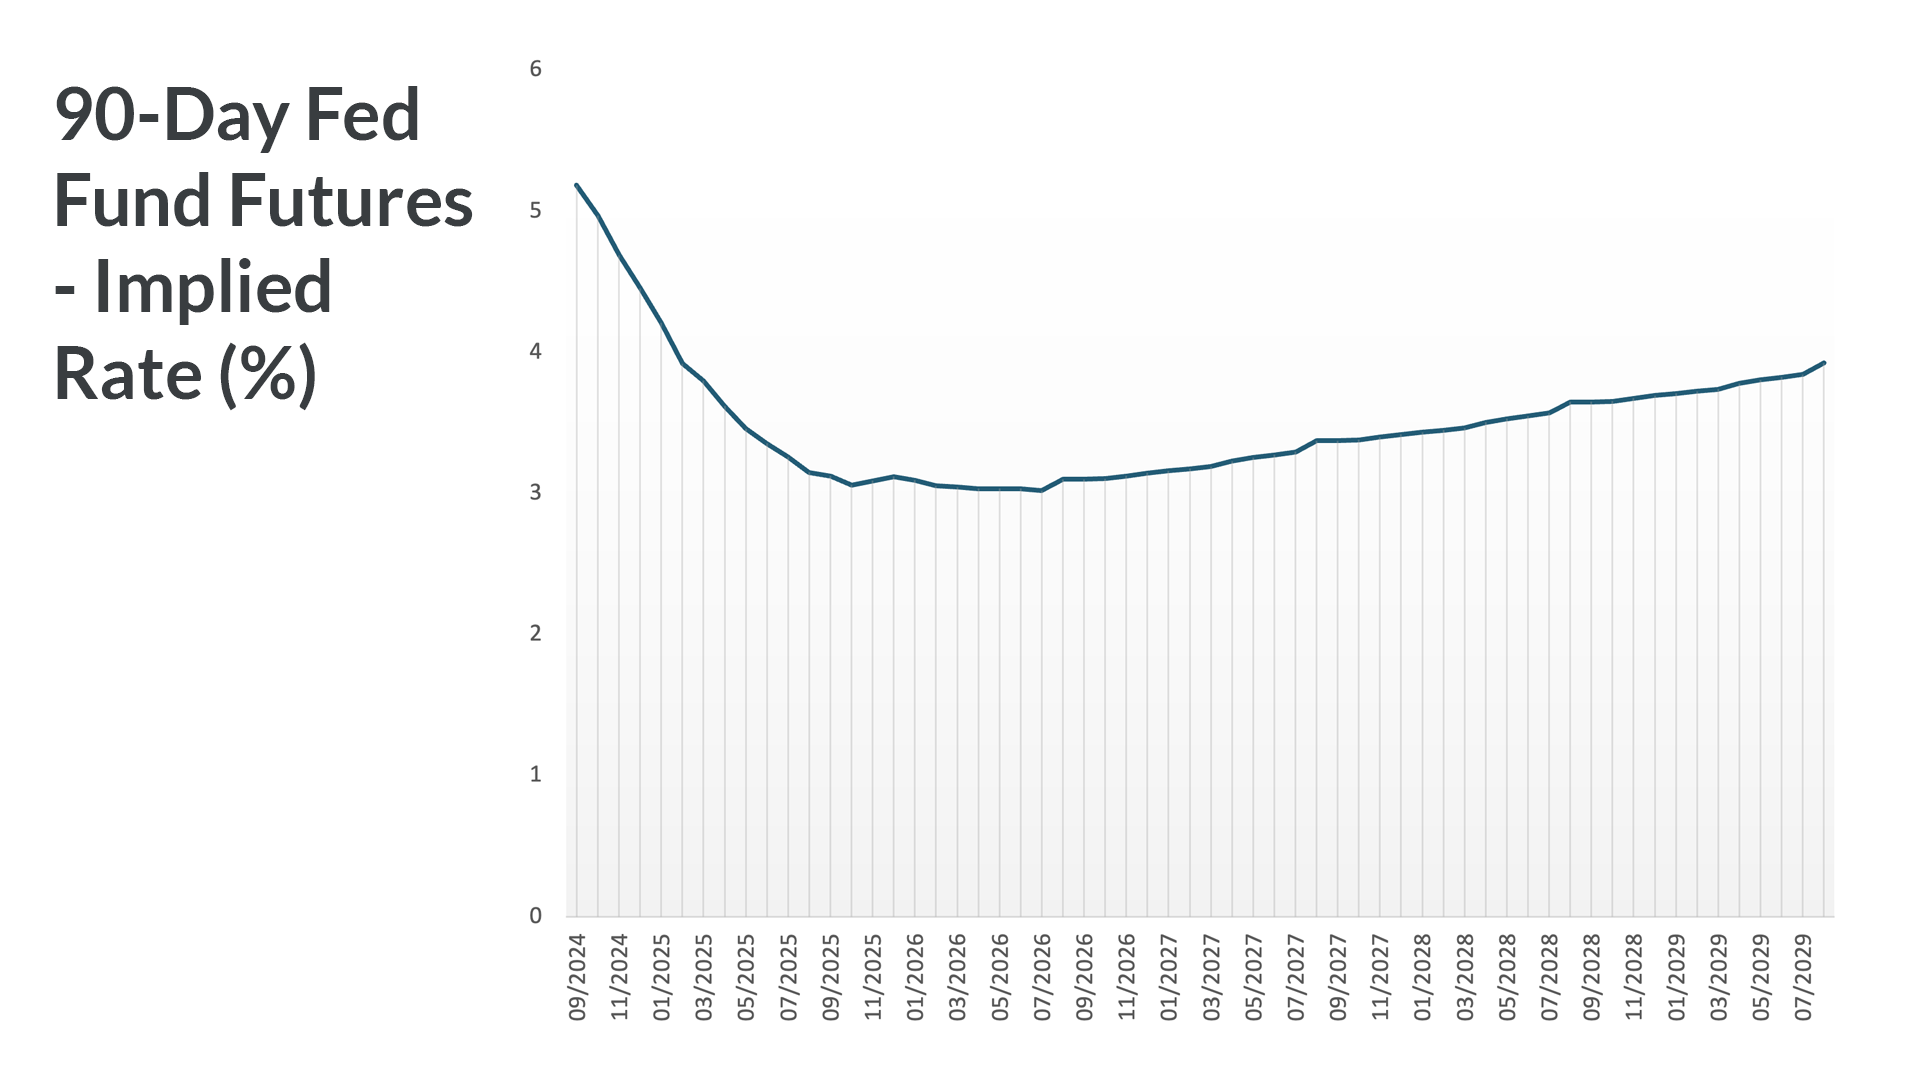
ii. Source – Bloomberg
| Indexii | YTD TR (%) | July 28th-Sept 4th, 2024 |
|---|---|---|
| US Large Cap – S&P 500 | 16.48% | (0.19)% |
| US Large Cap – Tech Heavy NASDAQ | 14.67% | (2.59)% |
| International Equity – MSACWI ex US | 9.43% | 0.81% |
| US Small/Mid Cap – Russell 2500 | 5.92% | (3.66)% |
| Bloomberg Aggregate Intermediate Bond Index | 4.03% | 2.38% |
ii. Source – Bloomberg
With slowing economic indicators and the 2nd quarter earnings releases showing tepid growth, equity performance since the end of the second quarter has been weak, particularly in the “crowded” Big Tech sectors we mentioned in our June and July newsletters. Expectations of interest rate cuts have helped keep the broad S&P 500 index flat since the end of June and falling bond yields have driven appreciable performance in the fixed income sector as illustrated by the Bloomberg Aggregate Bond Index in the table above.
While we believe that cuts in the overnight Fed Funds rate will happen at the September, November, and December FOMC meetings, we would caution against the expectation of significant tailwinds across all risk assets because of a decline in short-term money market rates. Longer term bond yields are equally dependent on debt issuance by the US Treasury and our outlook for the supply of additional Treasuries putting upward pressure on intermediate and long-term bond yields remains sobering. The trajectory of our fiscal deficits and national debt shows little signs of prudent fiscal management, and neither party has articulated any credible plan of putting the nation’s fiscal house in order. While we, like Warren Buffet, believe that changes in rates drive changes in value of risk assets, we believe bond yields are as influential a determinant as the overnight Fed Funds rate.
US Federal Debt – A Historical Perspective
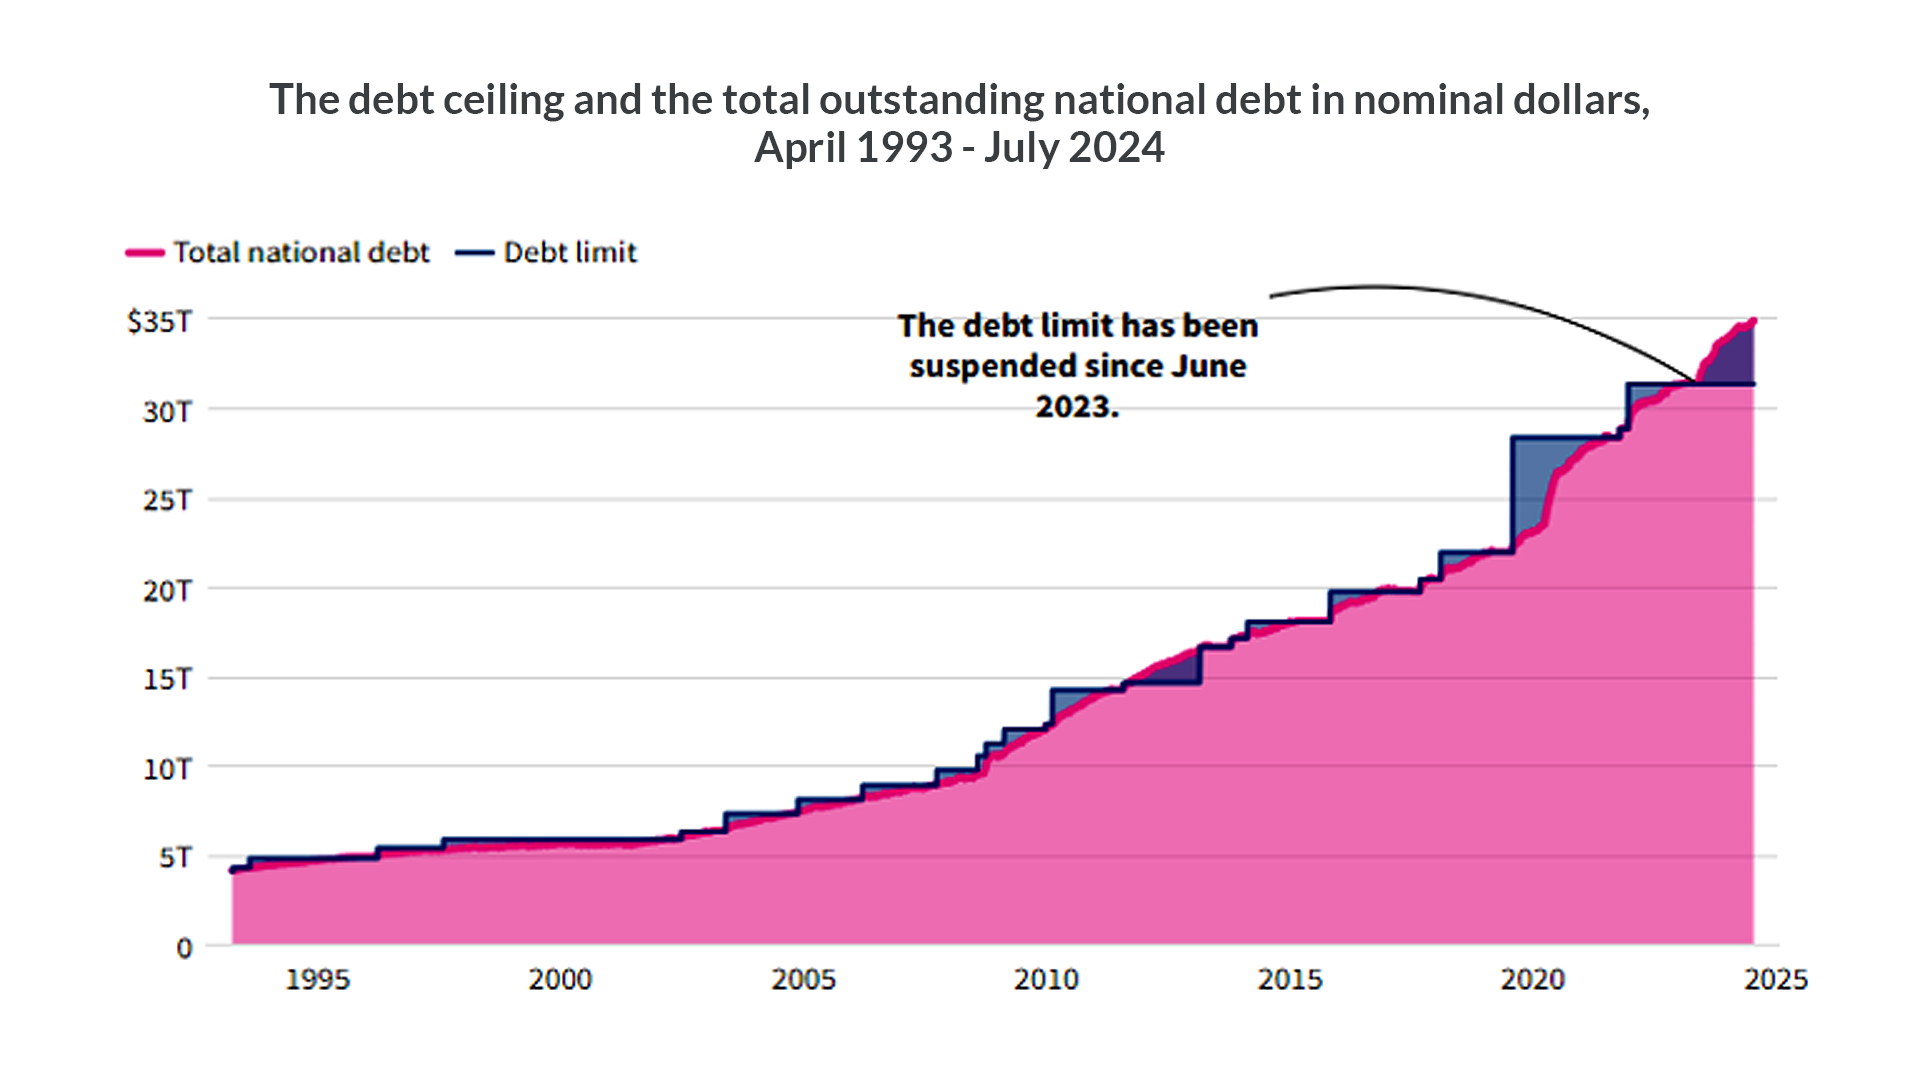
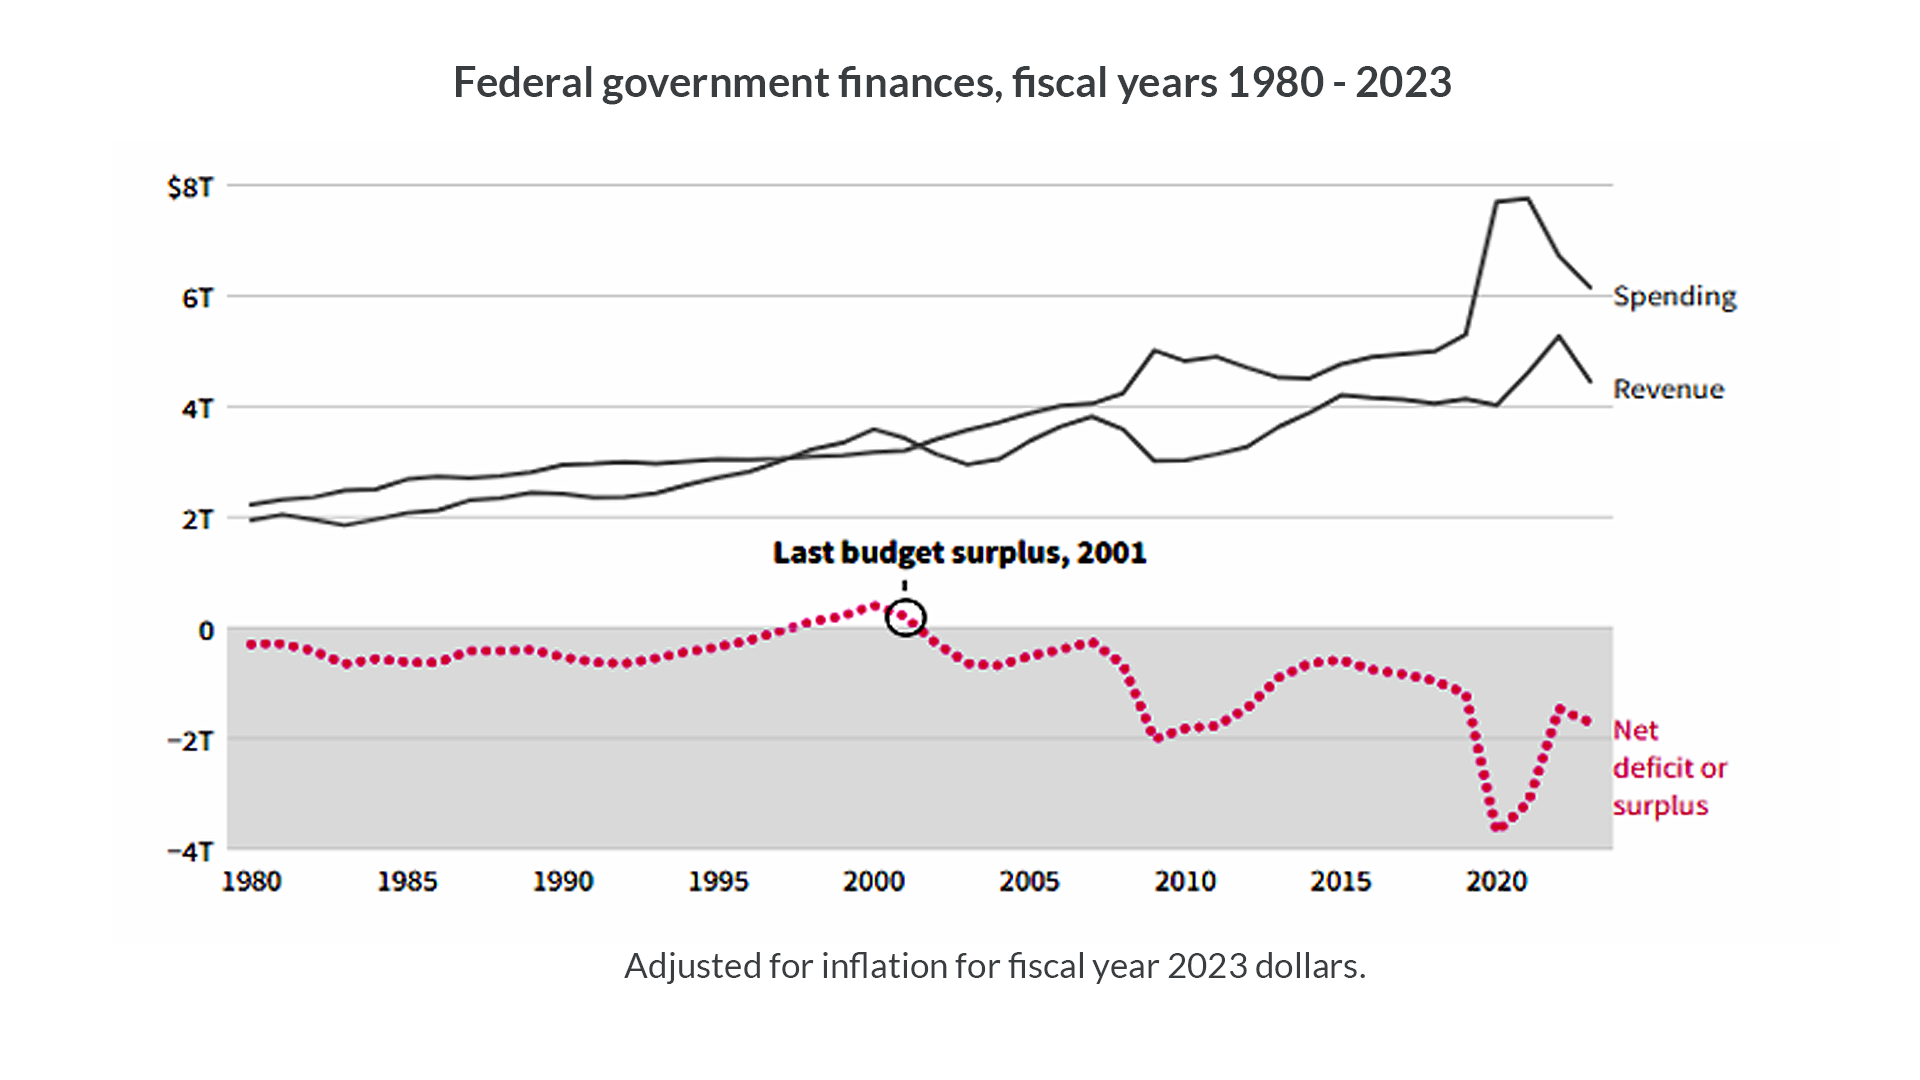
iii. Source/Credit – US Department of Treasury, Office of Management & Budget. Courtesy – USA Facts
The US Federal Debt Chart and the chart depicting the trajectory of Federal Government finances since 1980 – both depicted above, paint a sobering picture of our nation’s fiscal situation. Taking a multi-decade view, US Federal debt was just shy of $5 trillion at the start of 1995 – see chart marked “the debt ceiling and total outstanding notional debt”. Fast forward to the present, the national debt is currently near $35 trillion, reflecting a long-term annual growth rate of approximately 7%. During the same period, US GDP growth – in Nominal Terms (including inflation) has averaged 4.7%.iv Thus, with Debt growing faster than GDP, the US debt to GDP ratio has grown from about 65% to over 120%.v The second chart marked “federal government finances…” depicts in time series, the gap between total taxation revenue and total spending at the Federal government level. The key takeaway is that Congress habitually spends more than it raises from taxpayers – the only surplus was in the FY 2000-2001. More alarmingly, the size of the fiscal deficit is currently about $1.7 trillion, meaning an additional $1.5 trillion to $2 trillion in US Treasury debt will be issued to address the funding gap.
Implications
The state of our national finance almost ensures large funding gaps that will be met through debt issuance unless Congress increases taxes or sharply reduces spending. The latter is particularly difficult as non-discretionary spending (Social Security, Medicare/Medicaid, and Interest on Debt) along with defense spending account for close to 60% of total federal government spending.vi We would wager that higher taxes could be the more politically expedient way to address the funding gap; but higher taxes are also a difficult policy from an electoral perspective. As such, we see continued issuance of Treasury debt, with the knock-on effects on intermediate and long-term bond yields, despite more accommodative monetary policy by the FOMC regarding the overnight Fed funds rate. Thus, we remain cautious as to the extent risk assets may benefit from upcoming FOMC rate cuts.
Recommendations
As discussed in prior letters, we recommend clients with highly concentrated allocations to large cap US equities consider increasing the weightings of fixed income assets in their overall portfolios. This will help dampen unforeseen volatility. For eligible clients, investments in Private Equity, Real Estate, and Infrastructure through limited private partnerships may help further diversify their asset allocations and capture a certain level of uncorrelated returns (alpha) from uncrowded off market deals, and various tax-efficient structures. For help in reviewing your portfolios and making any necessary changes, please contact our Portfolio Management Group at 1 (800) 799-3320.
i. Source – Bloomberg
ii. Source – Bloomberg
iii. Source/Credit – US Department of Treasury, Office of Management & Budget. Courtesy – USA Facts
iv. Source – Bloomberg
v. Source- Trading Economics
vi. Source – Govinfo.gov and Census.gov 2022
