Navigating the current rate environment
Coming off the largest interest rate increases in many decades, bond investors now have investment opportunities that have not existed in the debt markets for over a decade. The chart below shows the relationship between the 10 Year US Treasury Bond yield and the year-over-year rate of the All-Urban CPI (one of the most widely used measures of inflation).
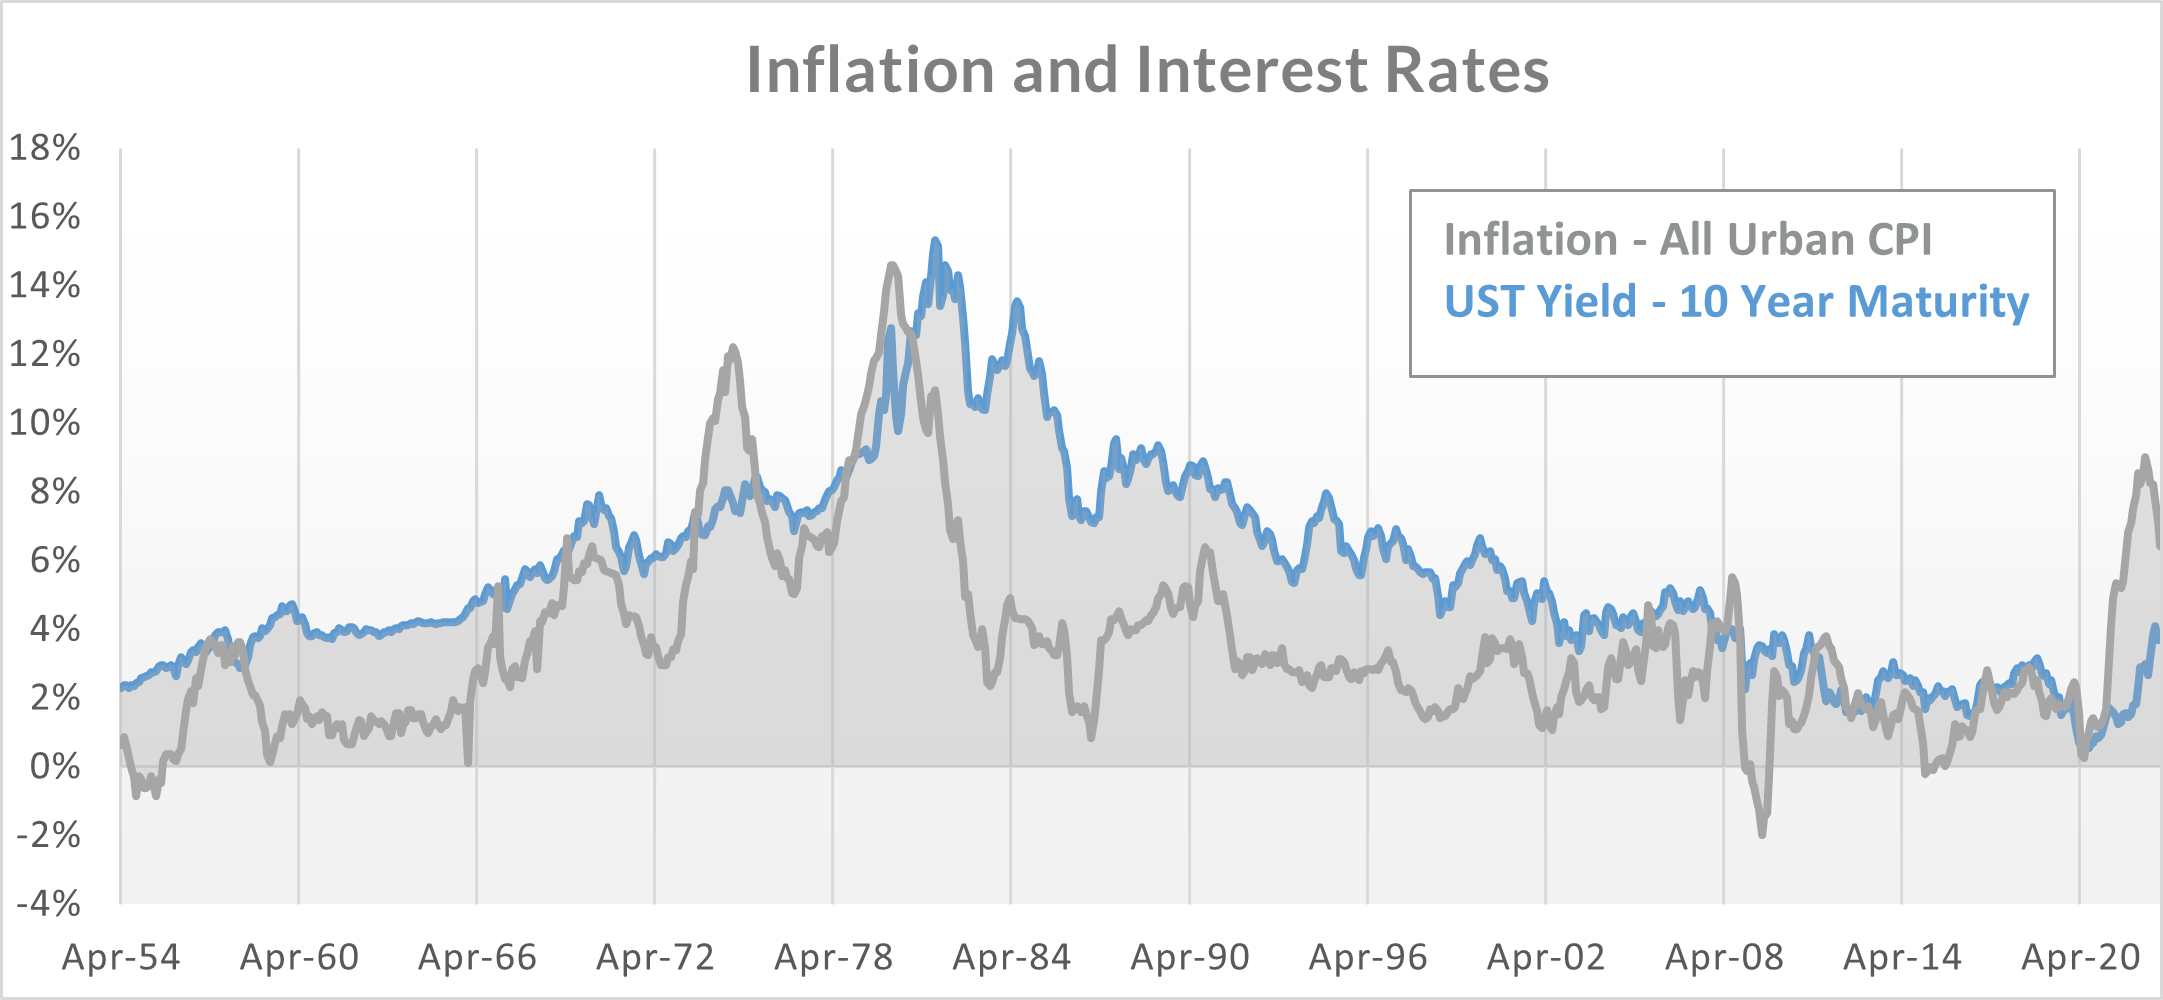
Figure 1
As the chart shows, inflation in 2022 spiked to levels not seen since the 1970s. In response, the FOMC (Federal Open Market Committee) raised short-term rates from 0 to over 4% in a year’s time. The interest rate increases are designed to slow economic growth and bring the rate of inflation back to their 2% target. If history is a guide, policymakers will succeed in their efforts, but the process is likely to take more time than many investors anticipate. This means is that bond investors will be rewarded with yields not seen in many years, which will add significantly to investment returns.
The Yield Curve and Higher Yields: How To Benefit
This sharp rise in yields has left the US Treasury yield curve inverted – a condition where short-term rates are higher than long-term rates. Inverted yield curves exist occasionally and are typically a response to FOMC policy and expected future economic conditions. The next chart shows a history of the US Treasury yield curve for the past decade. As you can see, the current inversion is significant and has prompted some economists and market watchers to predict an imminent recession. When we have an inverted yield like the one that currently exists, an economic recession often follows, but it is not always the case. There are times when the yield curve returns to it’s normal (positive) shape without the economy entering into a recession.
Regardless of whether or not a recession ensues, the return to a normal shaped yield curve will eventually become a reality. Yield curve inversions typically last for 8-18 months, while 90% of the time the curve is normally (positively) shaped. A positive sloped yield curve is based on the notion of the term structure of interest rates and the idea that investors who are willing to purchase bonds with longer maturities should be rewarded for taking the risk of higher inflation and the greater price volatility that comes with investing at a fixed rate of return for longer periods of time. The chart below shows the shape of the yield curve over the past decade and demonstrates the notion that it is positively sloped the majority of the time.

Figure 2
When the yield curve is inverted, investors tend to buy shorter maturity bonds with better yields. However, history has shown that this strategy typically results in lower returns over longer periods of time.
Lessons from the 1970’s and the “vulker fed”
During the decade of the 1970s, inflation in the US rose steadily as Federal Reserve Policy was too lax. In addition, policy mistakes such as indexing wages to the rate of inflation contributed to what became known as a “wage/price inflation spiral.” In other words, indexing wages to inflation meant workers became insensitive to the impact of inflation. One of the results was rising inflation along with rising unemployment. In the late 1970s, a new Federal Reserve Chairman by the name of Paul Volker took the reins and began a multiyear effort to break the inflation spiral that had taken hold in the economy.
In order to bring down the rate of inflation, the FOMC under Volcker began raising short-term interest rates to levels never seen – the yield on short-term treasury bills eventually reached levels approaching 20%. At the same time, yields on 30-year US Treasury Bonds topped out at just above 14%. With the US Treasury yield curve significantly inverted, investors piled into short-term treasury bills and ignored long dated maturities. That investment decision turned out to be a grave mistake that only became apparent years later. As inflation receded and interest rates began to fall, yields on short-term treasuries fell faster than those on longer dated bonds. By 1983, they were well in the single digits and below longer-term treasuries. Investors who invested only in short maturities found themselves earning yields much lower than those who put at least a portion of their money into longer dated bonds. The best example of this phenomenon is the 30-year US Treasury bond issued in November of 1981. That bond was issued with a 14% coupon and a maturity date in November 2011. Investors who purchased that bond earned 14% a year for 30 years and a return of the original principal at maturity. By 2011, yields on three-month treasuries were at 0% and the average over that 30-year period was well below 5%.
What Should I Do Now?
In the current environment, we recommend investors create a broadly diversified portfolio of bonds that contains maturities ten years and beyond, along with bonds that mature in the 1-5 year range. This approach is sometimes referred to as a barbell approach. This strategy will provide attractive yields on short maturities while protecting yields over longer periods of time and in the event of future yield declines. If, as we expect, inflation recedes back to the 2% target, the FOMC policymakers will once again reduce short-term rates. This strategy will provide a more stable and better total rate of return than focusing entirely on the higher yields at the shorter end of the yield curve.
