“The important question for the investor is not whether conditions are good or bad (if, in fact, they can be measured on such a scale), but whether they are changing for the better or for the worse relative to expectations.”
- Arthur Zeikel, Professor of Finance, New York University.
Market Returns & Outlook
The markets were mixed as we entered the New Year in January, with stocks and bonds posting diverging returns for the month (see table below). January returns across major equity indexes now range from about (2.61)% in the US Small/Mid Cap sector to an impressive 1.68% in the large capitalization dominated S&P 500. Meanwhile, in the bond market, the Bloomberg Aggregate posted a monthly return of (0.27)% in January, driven by stronger than expected GDP growth, and thus reduced prospects of aggressive Fed rate cuts to support the economy.
| Index | YTD TR (%) | January 2024 |
|---|---|---|
| US Large Cap - S&P 500 | 1.68% | 1.68% |
| US Large Cap – Tech Heavy NASDAQ | 1.04% | 1.04% |
| International Equity – MSACWI ex US | (0.98)% | (0.98)% |
| US Small/Mid Cap – Russell 2500 | (2.61)% | (2.61)% |
| Bloomberg Aggregate Intermediate Bond Index | (0.27)% | (0.27)% |
Index of Ten Leading Indicators vs. US GDP
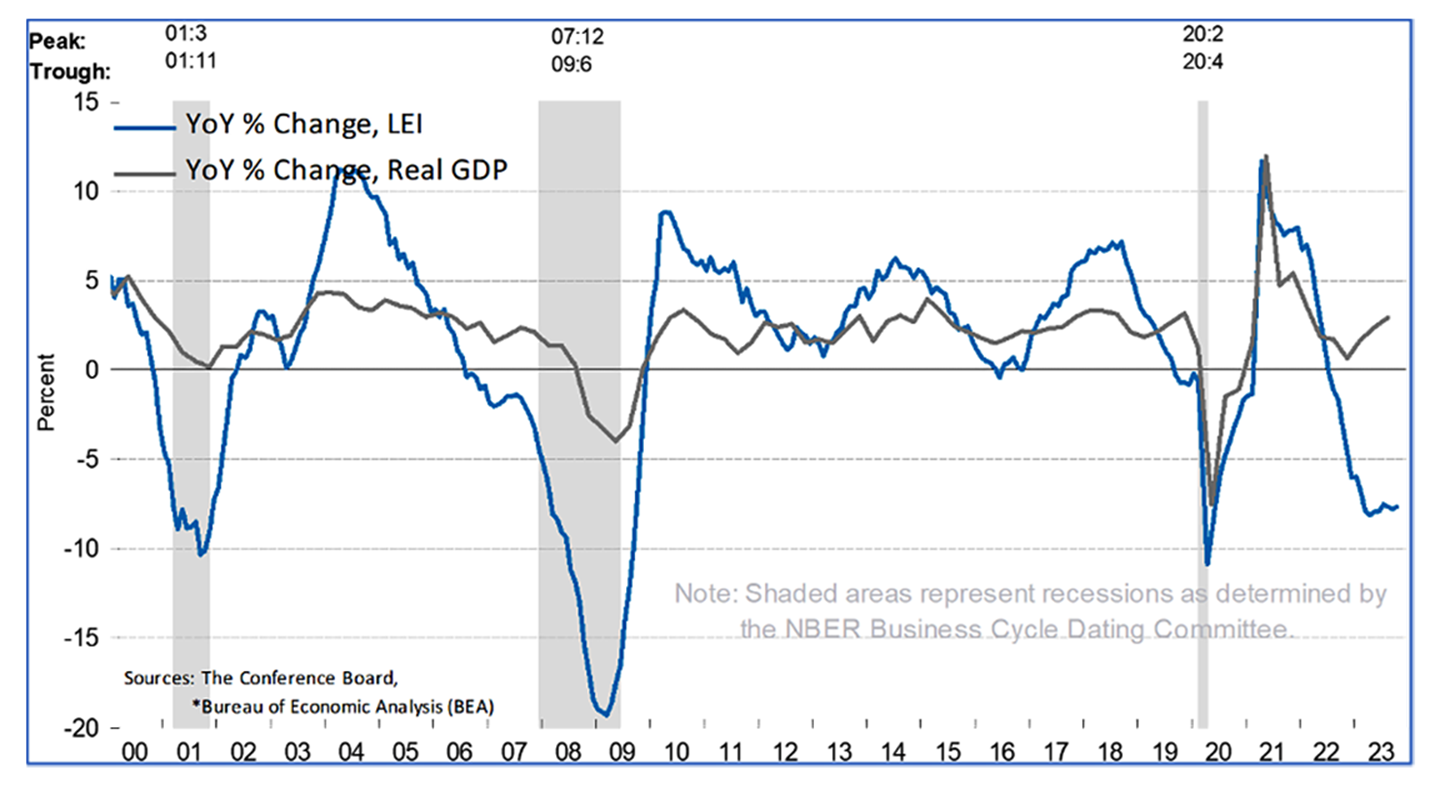
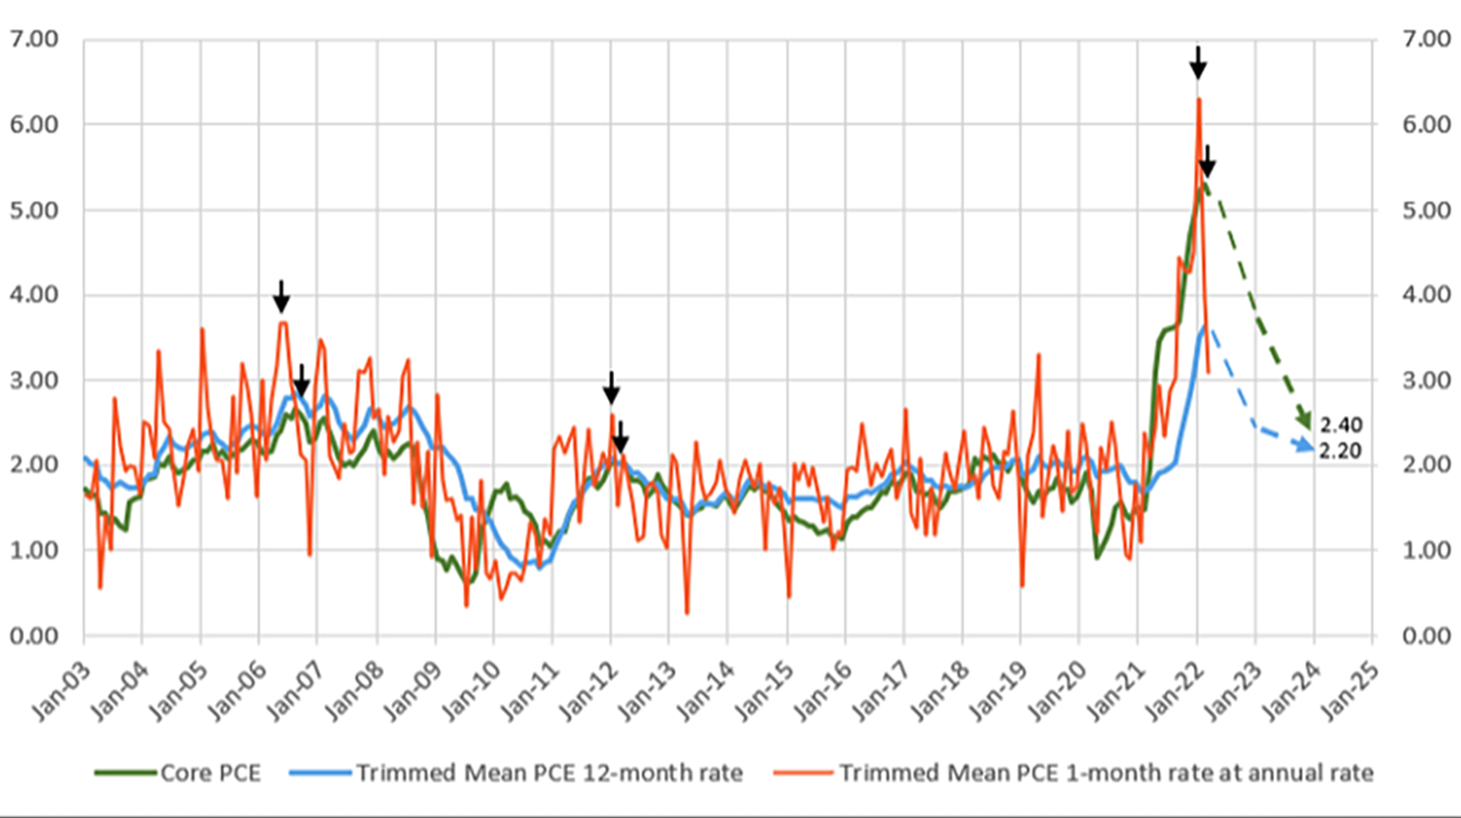
After the first FOMC meeting of 2024 on January 30th and 31st, Federal Reserve Bank Chairman Jerome Powell dampened hopes of an early schedule of cuts in the Federal Funds rate as US GDP and employment remained surprisingly resilient given the acute rate hikes of 2022 through the first half of 2023. However, it is becoming clear that the rate hikes are gradually permeating through the overall economy. Core Inflation (see chart below) is fast approaching the Federal Reserve Bank’s 2% target. While growth and employment remain strong (Advance Estimate for 4Q 2023 US Real GDP Growth is 3.3%, and the US Unemployment rate is at 3.7%), both are considered “lagging” indicators – essentially past activity akin to looking through a “rearview mirror”. Washington based economic think tank, The Conference Board tabulates an index of ten “leading” indicators – ranging from financial components such as Credit Growth, Stock Prices, and the spread between 10-year US Treasury rates and overnight Fed Funds; to non-financial components ISM Index of New Orders, Building Permits for Private Housing and Average Weekly Hours Worked among others. This index (see blue trendline in the chart above) has been down for 22 consecutive months starting early 2022. And, as can be extrapolated from chart 1 above, rapid and sustained deterioration in the ten leading indicators is a predictor for declining GDP growth and ultimately an economic contraction.
US Inflation: One-Month Trimmed PCE
Implications
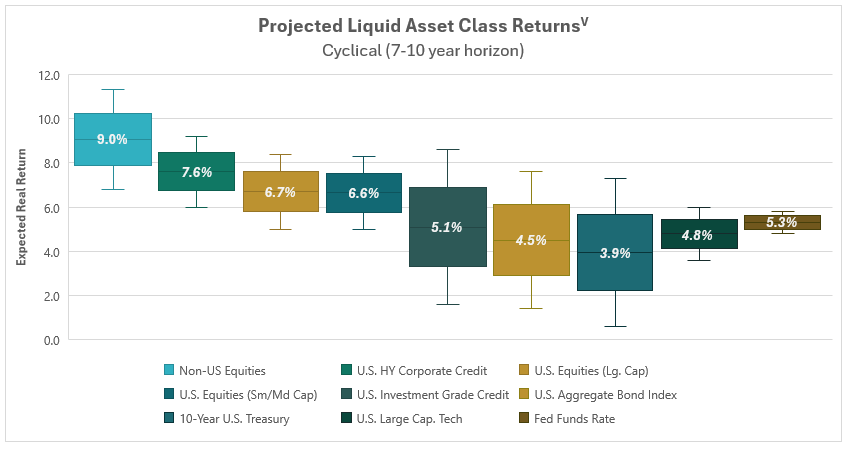
Following the superlative performance of US Equities in 2023 and an appreciable rebound in the bond markets, we feel that our clients should temper their expectations for asset class returns as we look ahead to the next cycle. As our readers are aware, we do not “predict” future returns; our process by contrast involves looking at what is being “priced in” given the level of asset prices – call this a “risk premium,” and the risks to the implied returns given our understanding of the underlying assets. A key consideration in constructing our outlook is our belief that the economy is cyclical – oscillating between periods of growth and inflation fueled by cheap credit and then declining growth and disinflation (and at the extreme, deflation) triggered by tight credit and excess inventory. At this juncture we feel that we may be approaching the inflexion point between growth/inflation period to a period of contracting growth and disinflation, resulting in a more sober outlook for consumer spending, business investment and thus, business earnings. Our view is underpinned by sharp contraction in the ten leading indicators as discussed as earlier. However, whether the economy experiences a “soft landing” (shallow recession) or a “hard landing” (significant recession), we believe in an eventual recovery with more accommodative monetary policy and productivity gains. However, “timing” the cycle perfectly is a fool’s errand, and we implore our clients to focus on their long-term financial goals in their asset allocation and temper their expectations to a more moderate level of returns relative to the last decade. The chart below shows our current projections for returns across the liquid asset classes.
Recommendations
We continue to advocate an elevated level of diversification across asset classes and develop specific asset allocation parameters that cater to individual risk-tolerance thresholds. In the context of higher yields and the prospect of slower economic growth, Fixed Income assets should command a higher weighting in most portfolios; we would highly recommend our clients to reach out for a portfolio review if one hasn’t been done over the course of the last 24-36 months. We also believe that non-traditional asset classes – “real assets” such as real estate and infrastructure, as well as private equity and private credit merit consideration given the real portfolio enhancement opportunities as we transition to a potentially lower growth and earnings environment. For investors with a long-term investment horizon, the illiquidity premium in private assets is an attractive source of additional returns.
*Investment in private equity may require accreditation.*

Udayan Mitra, CFA
Udayan is Trajan Wealth's CIO with over two decades of experience in the investment management industry. He earned a Bachelor of Science degree in Economics from the London School of Economics and an MBA in Finance from Rice University.


