“In the short run, the market is a voting machine but in the long run it is a weighing machine.”
~ Benjamin Graham
Earnings, Valuations, and Discount Ratesi
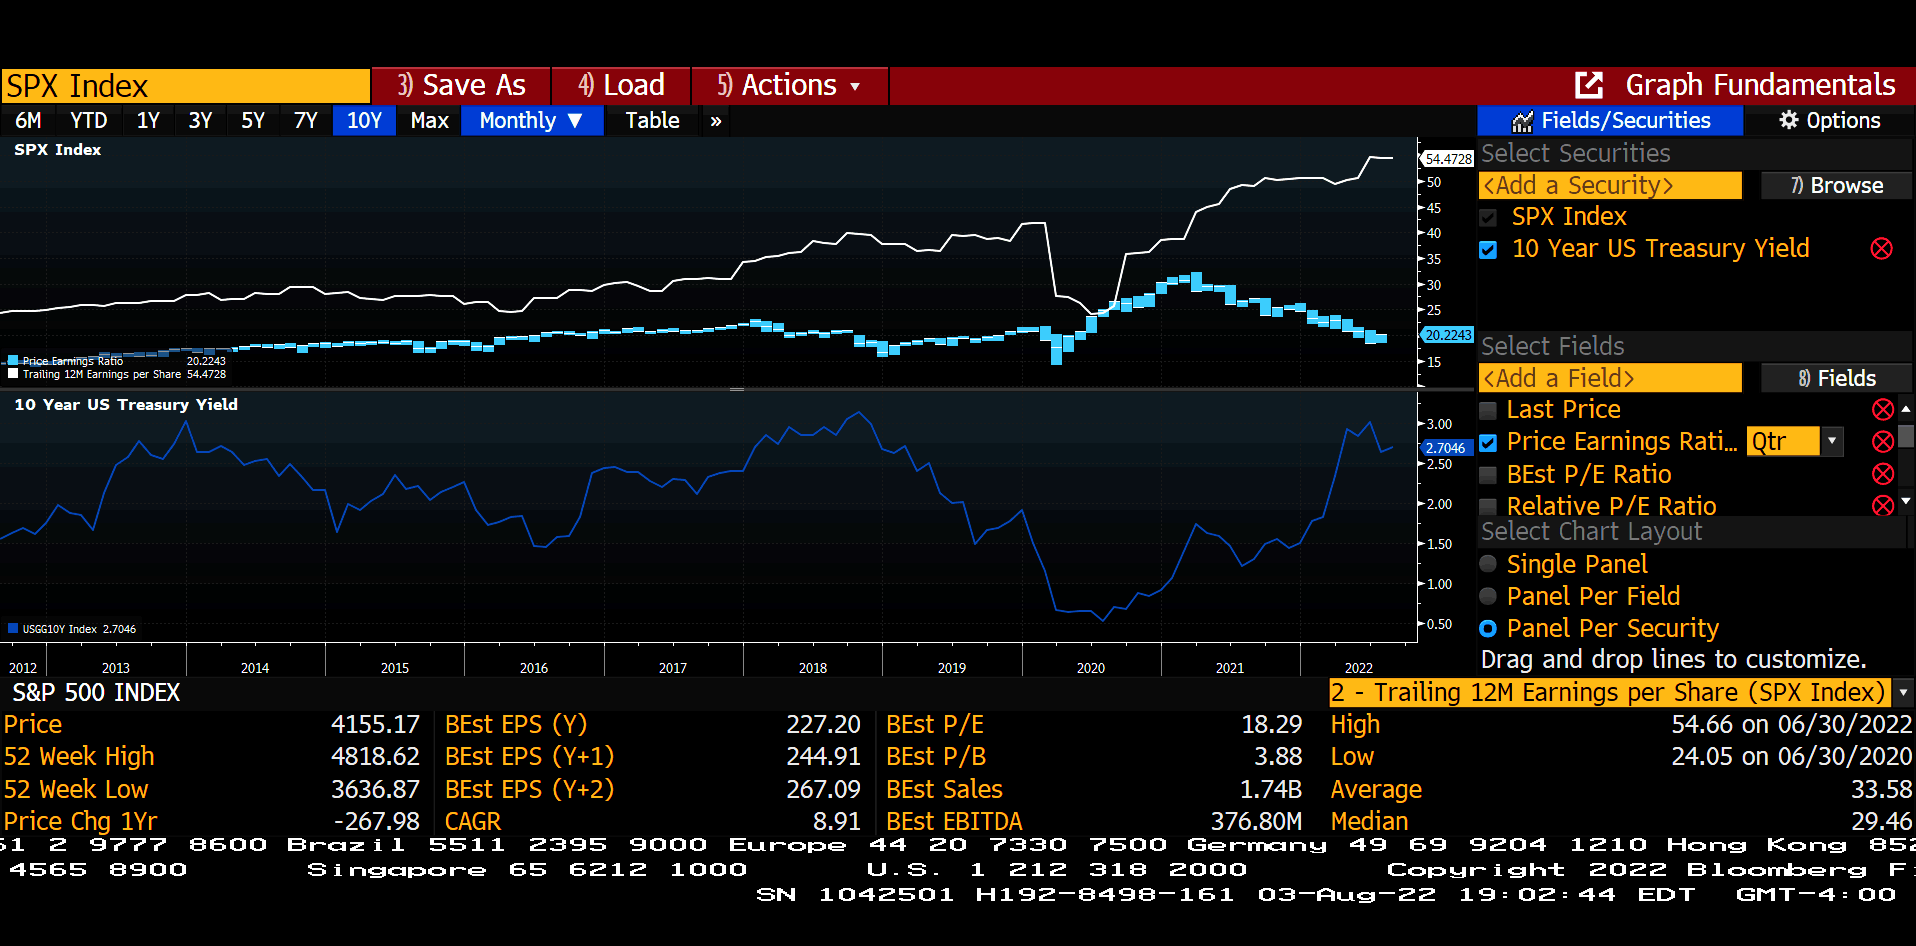
Fig 1: Bloomberg– S&P 500 Earnings Estimates, PE Ratio, and US 10-Year Treasury Yields in time series
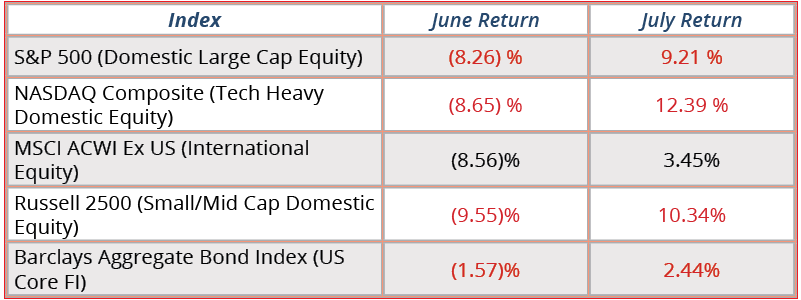
The month of July was the start of 2Q 2022 earnings season in Corporate America. Bell weather technology companies that represent ~20% of the overall index (Apple, Microsoft, Google-Alphabet, and Amazon) reported strong year over year results and Analyst expectations for earnings growth for the S&P 500 (represented by the white line in the graph above) show continued upward momentum going forward. Steady earnings, combined with growing belief that the FOMC will ultimately get inflation under control generated strong equity and fixed income returns, particularly in the United States. This was impressive after concerns of a recession and persistent inflation caused a sizable market drawdown in June and one of the worst first halves of the year on record. The performance of financial markets in July was all the more impressive considering the Federal Reserve Bank’s FOMC raised the overnight Fed Funds rate by 75 basis points – 0.75% at its July 27th FOMC meeting and reiterated its commitment to continue tightening monetary policy until inflation readings start falling towards its target of 2.0-2.5%.
Reflecting on the turnaround, it is important taking stock of an apt quote by one of history’s greatest investors, Benjamin Graham. Commenting on the impossibility of accurate predicting short term returns, Graham mentioned that in the short-term, the market is a voting machine – with disparate group of investors and speculators reacting to every piece of information of varying levels of relevance. Over time however, the true value of an asset is necessarily predicated on its ability to generate and grow cash earnings or free cash flows, the weight of the asset, or price trajectory being ultimately underpinned by profits/net cash flows. Thus, while valuation levels (P/E ratios) will drift by movements interest rates (see the dotted light blue P/E ratio trend line and the solid blue 10-year yield line on the above graph), a phenomenon witnessed in the first half of 2022; over the long term, earnings growth ultimately determines investor returns. At the time of writing, while there are chatters in recession (are we in one already, or when might we experience a contraction?), corporate earnings remain steady and Analyst forecasts for the market as a whole show continued upward momentum. As such, short of a sizeable, unexpected rise in long-term yields driven by persistently high inflation, our secular outlook for equity returns remains close to the long-term average. Our outlook for bond market returns remains close to current yield to maturities across the various fixed income sectors.
What About Inflation?ii
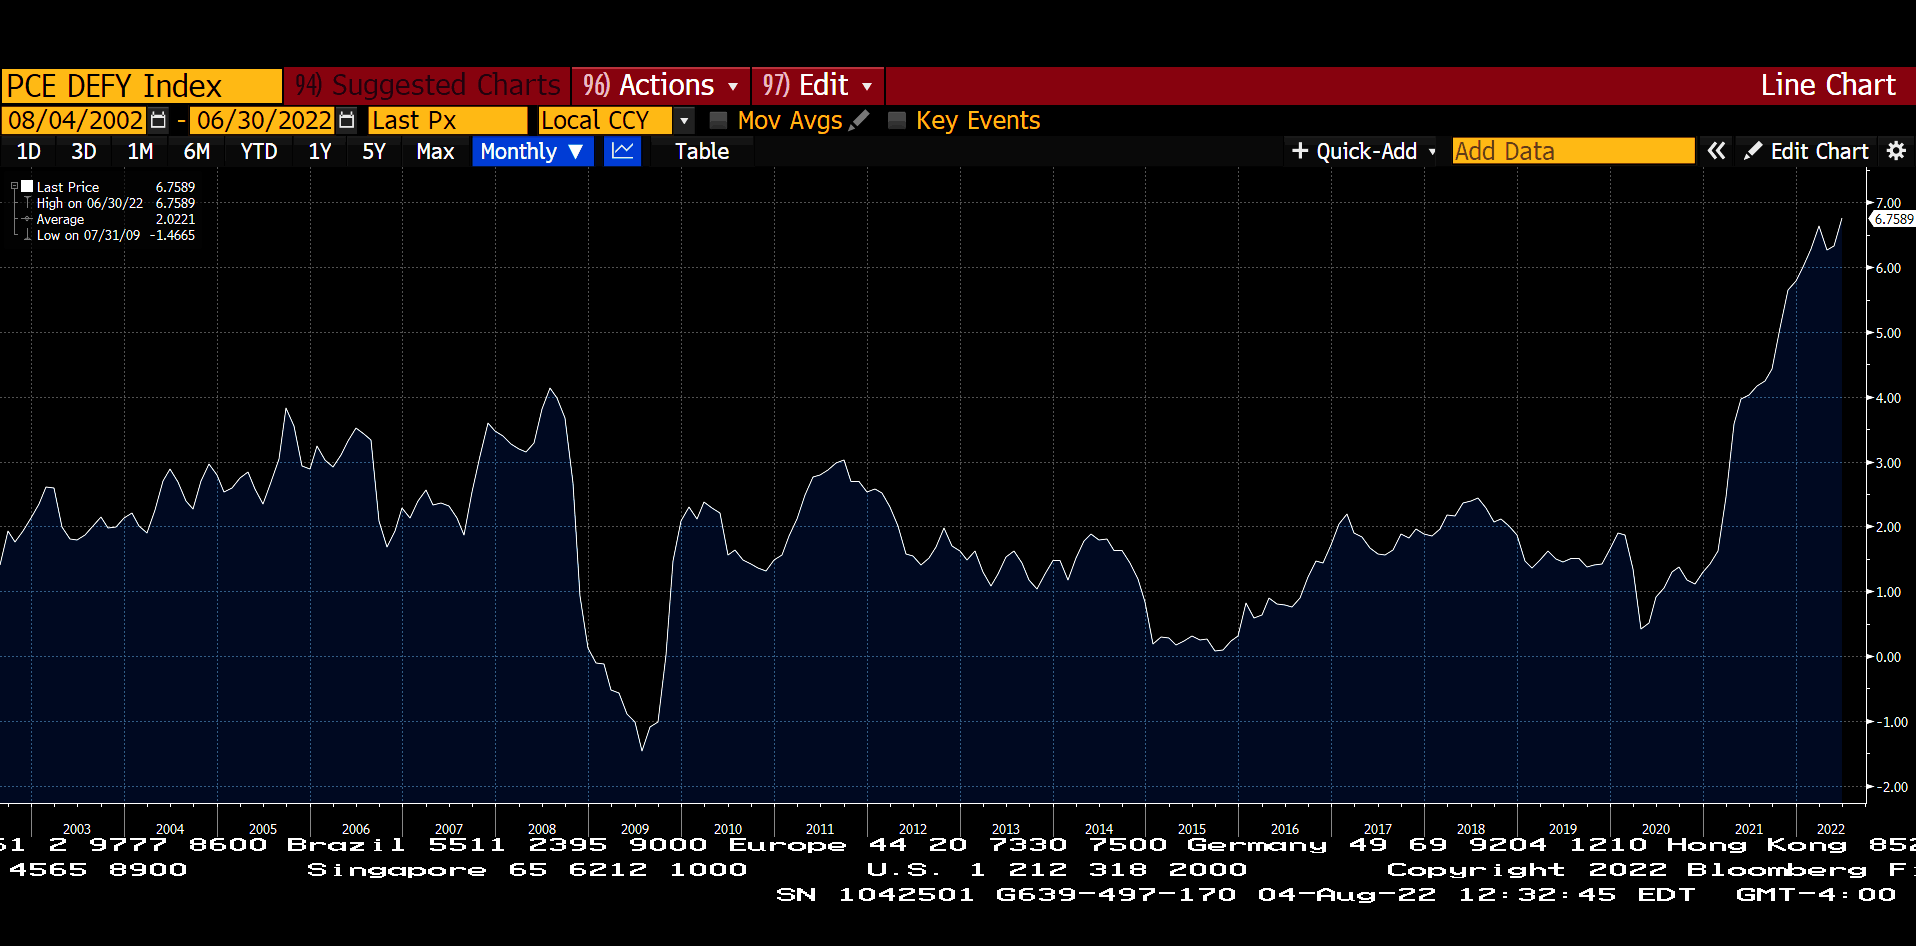
Fig 2: Bloomberg– US Personal Consumption Deflator
The Fed’s favored gauge of inflation, the Personal Consumption Expenditure Deflator (see chart above) remains persistently higher than the FOMC’s 2.00%-2.50% target. However, supply bottlenecks have started to ease in many key commodities. For example, West Texas Intermediate Crude has fallen by 27.5% since its June high of ~$122 per barrel, helping ease consumer gasoline prices. Similarly, the near-term gold futures contract is trading at $1,792 per 100 troy ounce after peaking $2,043 last March, a drop of over 12%. Gold is traditionally seen as an inflation hedge. Elsewhere, the wheat contract is down almost 40% since its May 2022 high of $1,279 per bushel, with obvious implications for future food prices.
Inflation ExpectationsIII
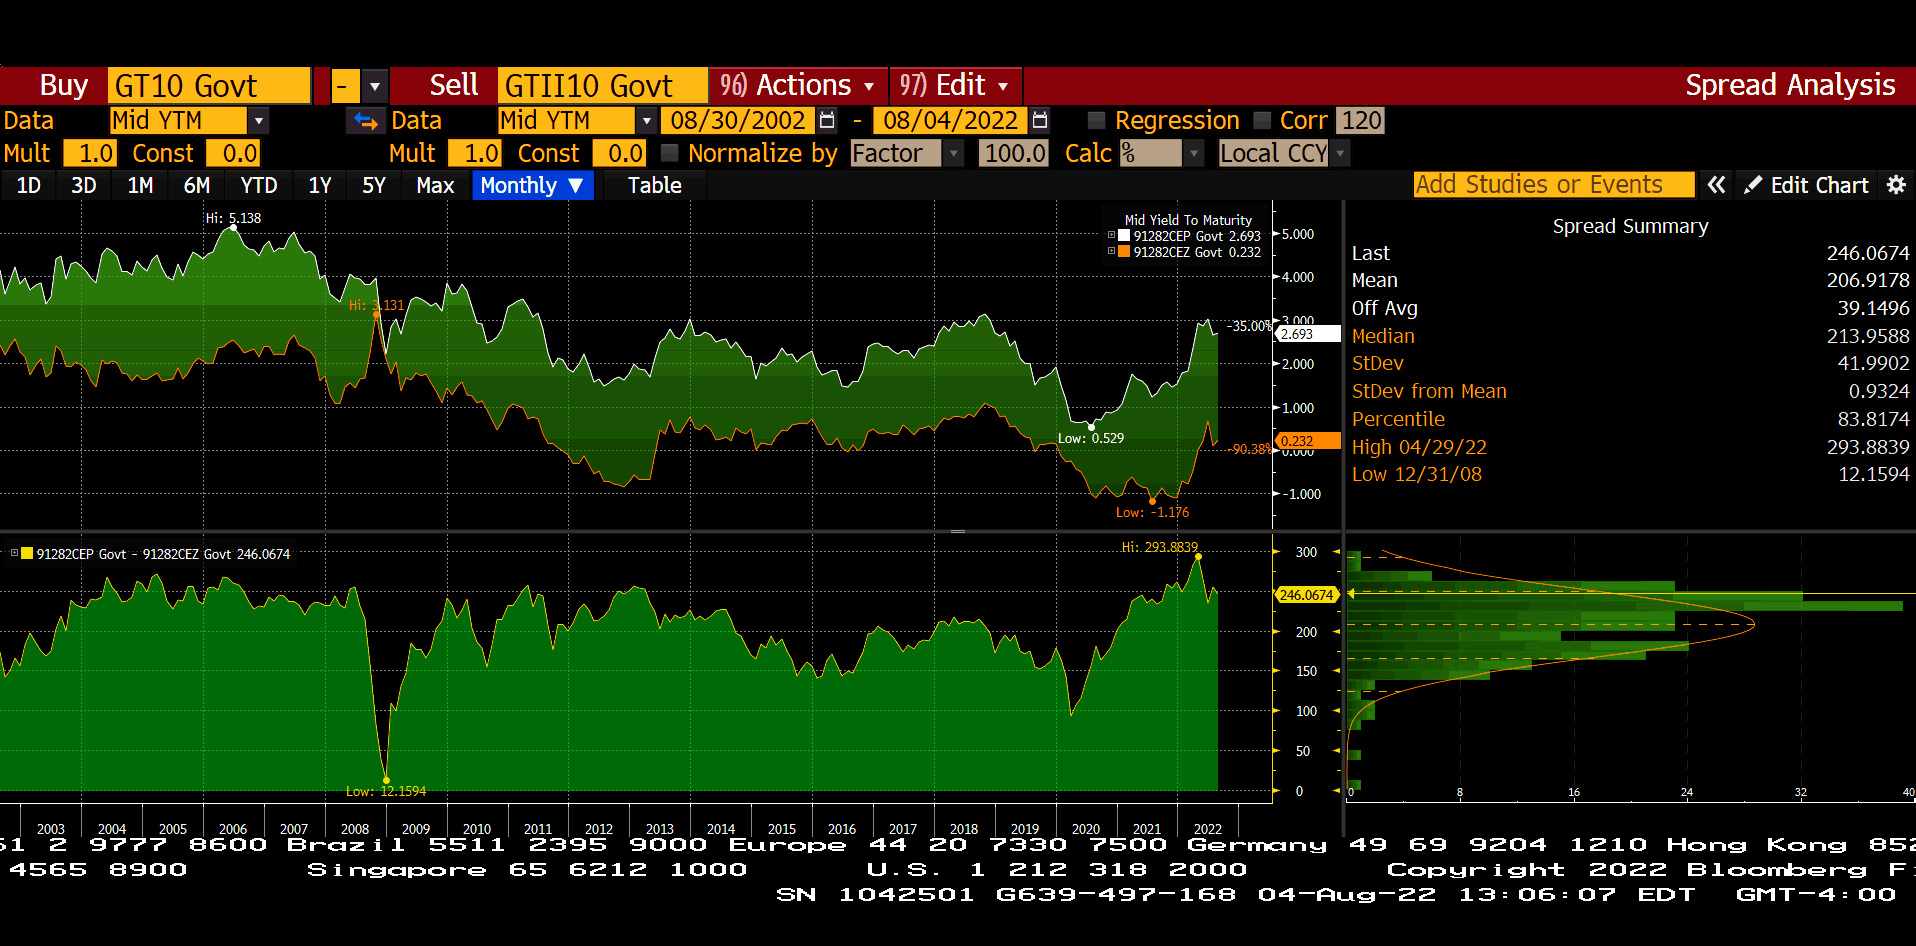
Fig. 3 : Bloomberg – Yield differential between 10-Year US Nominal and Inflation Protected Treasury note
USD Swaps – Spot & Forward Yield Curvesiv
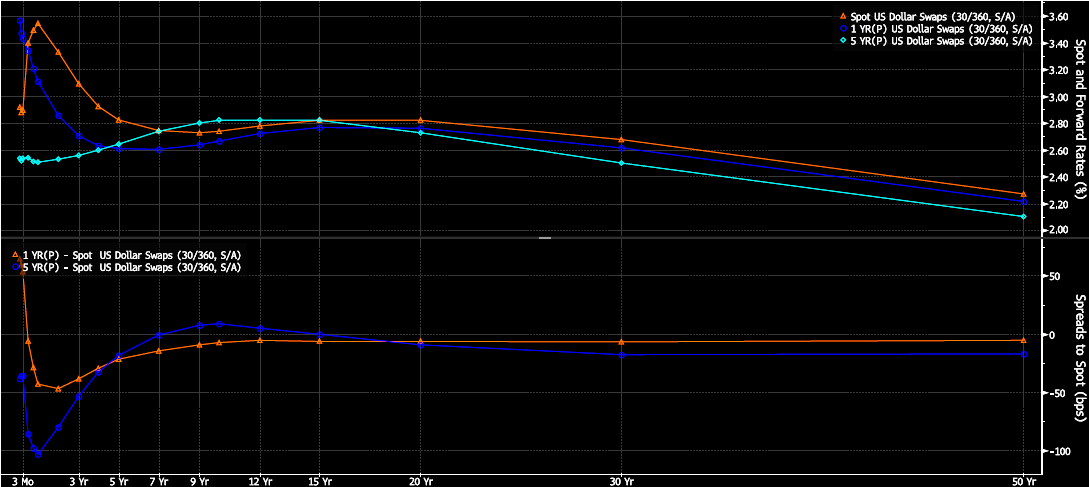
Fig. 4: Bloomberg – USD Swap Market – Spot and Forward Yields
While past readings are history, the market’s expectations for future inflation can be gauged by following the yield spread between US nominal Treasury notes and US inflation protected Treasury notes. In the latter, the US compensates investors for future inflation – thus inflation protected Treasury securities have a lower yield/coupon interest relative to nominal Treasury notes. The yield difference between nominal and inflation protected US Treasury notes in the forward expectation for inflation. Looking at 10-year spread between the two notes, the market is pricing an average inflation rate of 2.46% (see chart labeled “Inflation Expectations”) over the course of the next 10-years, lower than the 2.9% inflation that the US has experienced since 1900.
An additional gauge of inflation expectations is the shape of the yield curve – essentially the market clearing yields for a bond issuer across various bond maturities. In the upper chart in the graph marked “USD Swaps – Spot & Forward Yield Curve” above, the red line represents US Dollar borrowing costs for money center banks across maturities ranging from 3 months to 50 Years. Notice that longer term borrowing costs are lower than near term costs, the yield curve is essentially “inverted.” The dark and light blue lines in the same chart represents imputed bank borrowing cost one (dark blue) and five (light blue) years out. Notice, the forward projected yields are near or below todays borrowing costs, implying that interest rates are projected to remain stable of fall over the five-year horizon.
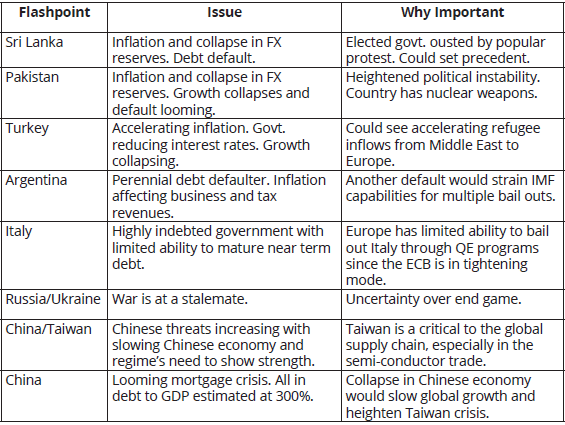
Geopolitical Risks
While not political analysts, we would be amiss to ignore the evolving geopolitical uncertainties that, if not managed carefully, could seriously impede the global economic recovery post the Covid-19 lockdowns. Momentum in corporate earnings can only be maintained in a stable economic environment and the current levels of geopolitical tensions seem the highest in almost a generation. Below is a sample of geopolitical issues that could cause regional/global instability. The list is not exhaustive but intended to show that political uncertainties span across various regions.
Recommendations
We continue to advocate active participation in the financial markets and urge our clients to stay disciplined and focused on their long-term financial goals. As investment practitioners, we also advocate diversification across asset classes in line with individual risk-tolerance thresholds. For investors with relatively long-term investment horizons, we suggest a sizeable allocation to equities as it remains the asset class best suited to enhancing long-term purchasing power. For investors with relatively shorter time horizons, allocations to bonds and other income producing assets – for example, commercial real estate, is an appropriate risk reduction measure in an overall investment portfolio. In view of both geopolitical uncertainties and the FOMC’s “end game” in terms of tightened monetary policy, we advocate a distinct quality bias in both asset allocation and security selection within investor portfolios.
UDAYAN MITRA, CFA
Trajan Wealth Chief Investment Officer


