“It’s clear to me when you do private equity well, you’re making companies more efficient and helping them grow and become more profitable. That success means our investors – such as public pension funds – benefit, which contributes to the economic wealth of society.”
~ David Rubenstein. CEO, Carlyle Group
Market Returns
As was the case in my previous newsletter, the US financial markets have continued to roar since the start of 2023, with stock market returns posting strong returns for the month of July 2023 (See table below). Year-to-date returns across equity indexes ranges from about 14.2% in the US Small/Mid-Cap sector to a whopping ~37.7% in the tech-heavy NASDAQ, substantially outperforming historical annual averages (note, we are only 7 months into 2023) spanning multiple decades. The US bond market meanwhile posted a YTD return of about 2% at the end of July, an appreciable turnaround from the horrendous results of 2022, during which the asset class returned a grim (13.0)%.
| Index | YTD TR (%) | 1 Year TR (%) July 2023 |
|---|---|---|
| US Large Cap – S&P 500 | 20.64% | 3.21% |
| US Large Cap – Tech Heavy NASDAQ | 37.72% | 4.08% |
| International Equity – MSACWI ex US | 14.37% | 4.09% |
| US Small/Mid Cap – Russell 2500 | 14.18% | 4.97% |
| Bloomberg Aggregate Intermediate Bond Index | 2.02% | (0.07)% |
With monthly returns on equity indexes posting 300 to 500 basis points in the past few months, we at Trajan Wealth keep asking ourselves the question – “what lies ahead”? It is a difficult question since we are not in the forecasting business – rather, we consider our job as investment managers to be centered around assessing risks across asset classes and to make informed judgments on valuations of the various asset classes. In this context, large-cap US equities (the S&P 500 and NASDAQ being representative examples) look fairly valued to slightly rich to us using standard techniques like Price Earnings ratios, while Small and Mid-Cap US stocks and international equities look relatively cheap. As long-term investors, we do not advocate a large-scale reallocation – Small/Mid Cap stocks are inherently riskier than Large Cap Stocks, but a modest reallocation or an initial allocation for investors with little or no exposure to the “cheap” sectors (SMID and International) may be warranted. While “mean reversion” (returns eventually trending towards long-term averages) is an observed phenomenon in investing, we cannot predict when this may happen. As such, we reiterate that reallocations should be “around the margins” in an otherwise well-diversified portfolio.
Growth & Earnings
The other aspect of trying to understand “what may lie ahead” in terms of investment returns is to observe the global macroeconomic trends and develop a data-driven point of view on growth patterns and, by extension, the ability of businesses to generate and grow cash earnings. In this context, we are currently witnessing a tapering down of global growth, in part driven by the need to service a large debt burden that most large nations acquired during the stimulus programs instituted to fight the economic contraction associated with Covid-19. As the two charts below depict, global growth rebounded sharply after the Covid lockdown was over in 2021. By mid-2022, the increased debt burden coupled with the higher debt servicing costs brought about by rising interest rates started to have an impact. GDP growth started leveling off (see chart 1.) while earnings growth started losing momentum (see dark blue line in chart 2). At the time of writing, second quarter earnings in the US equity markets are down about (7)% YOY, albeit coinciding with the fact that about 80% of companies reporting thus far have beaten analyst estimates. However, beating estimates is one thing (estimates are driven by corporate guidance anyway), but the magnitude of earnings is what we believe is more important. And declining growth in YOY earnings leads us to be cautious about the momentum for equity market returns going forward.
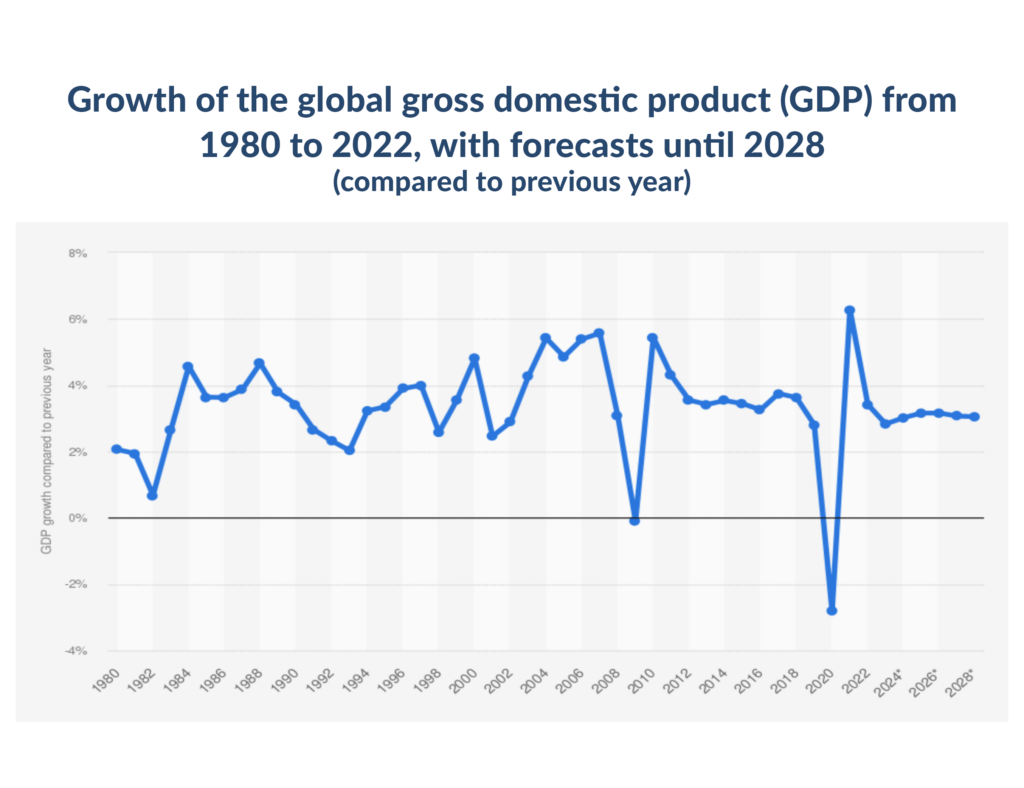
CHART 1. Source: IMF
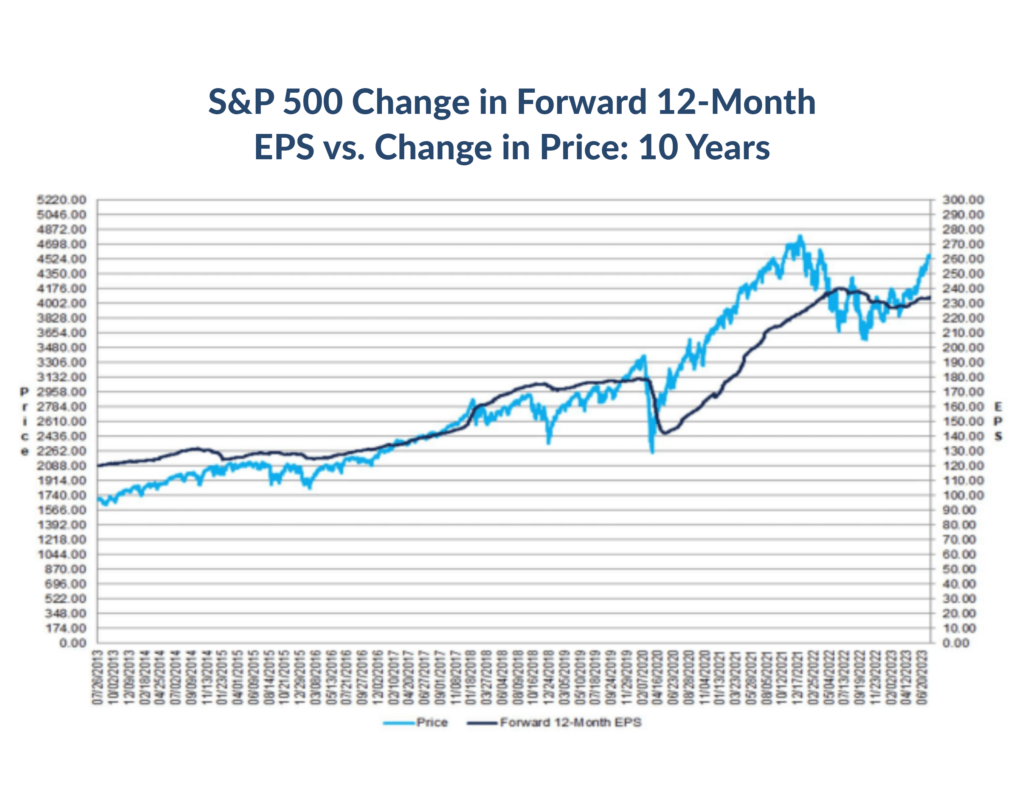
CHART 2. Source: FactSet
Private Assets
With the outlook for growth and earnings looking tempered going forward, we at Trajan Wealth believe that we can improve our clients’ investment outcomes by prudently allocating portions of their long-term investment portfolios towards private assets*. As mentioned in last month’s letter, private assets are assets that are not traded in the public markets and include the equity – Private Equity, and debt – Private Credit of private companies, Private Commercial Real Estate, and Private Infrastructure Funds – pools of capital invested in private infrastructure projects, to name a few. Being private assets, these asset classes are significantly illiquid, taking as much as a decade for the return of and the returns on invested capital. However, they tend to command a veritable and persistent illiquidity premium – see chart 3 . Since valuation changes only reflect changes in durable changes in earnings and cash flow, they tend to be less volatile than publicly traded assets – absence of momentum trades, short interest or short covering, algorithmic trading, and leveraged trades that result in amplifying volatility in publicly traded assets.
We recognize that the chart 3 represents the most recent 5-year period for which data is available to make risk/reward comparisons between private assets and their public market counterparts. Furthermore, the most recent 5-year period encompasses the Covid-19 years. However, our research into longer-term data confirms the existence of the illiquidity premium alluded to earlier, and we are underwriting both private equity managers and, where possible, the underlying assets, to generate an additional 4%-6% incremental return vs. comparable assets in the public markets. We feel this threshold is prudent – if public markets return 1%-1.5% less than their historical averages on an annual basis going into the next cycle due to high valuations, a ~20% allocation to private markets would help mitigate the shortfall. In addition, the lower volatility characteristic of private assets helps stabilize overall portfolio valuations.
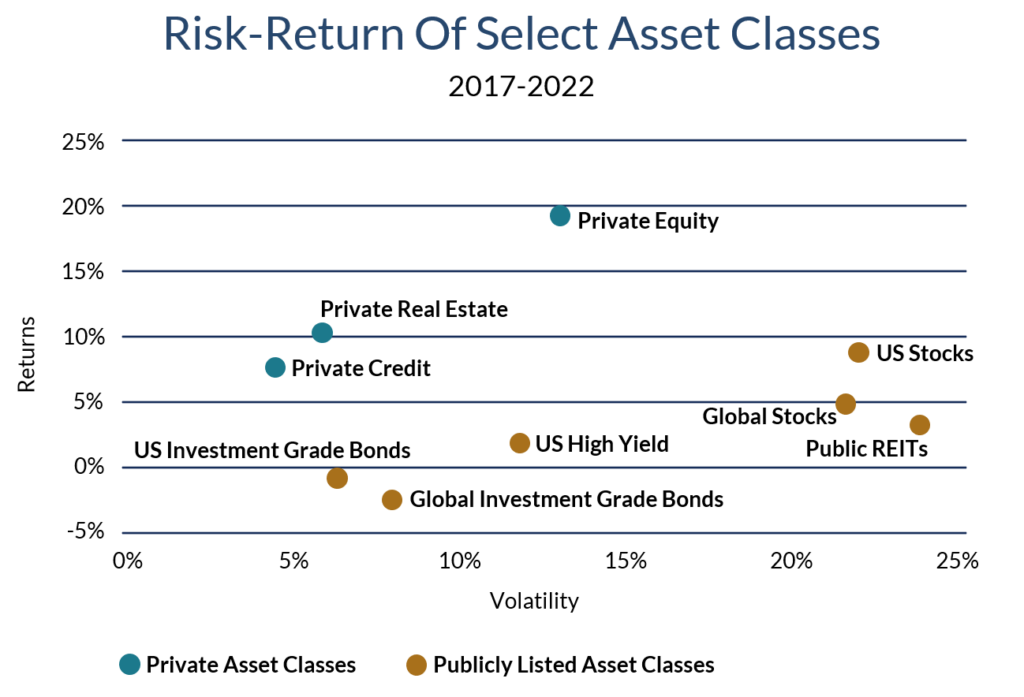
Chart 3. Source: Morningstar Direct for the 5-year period ending 9/30/22. Observations about returns, volatility, and correlation are based on the following indices. Public markets: For US Stocks, S&P 500 Index; for Global Stocks, MSCI ACWI Index; for Global Investment Grade Bonds: Bloomberg Global Aggregate Bond Index; for Public REITs: MSCI US REIT Index; for High Yield Bonds: Bloomberg US Corporate High Yield Bond Index. Private markets: for Private Equity, Cambridge Assoc. US Private Equity Index; for Private Credit: Cliffwater Direct Lending Index; for Private Real Estate: NCREIF ODCE Index. Past performance is not necessarily indicative of future results. There can be no assurance any alternative asset class will achieve their objectives or avoid significant losses. These indices have been selected as generally well-known and widely recognized indices and not as a benchmark for any specific fund. Equity indices include reinvestment of dividends. Any investment involves a high degree of risk and should only be made if an investor can afford the loss of the entire investment. The are no guarantees or assurances regarding the achievement of investment objectives or performance and you could lose some or all of your investment. Investment performance may be volatile. An investment should only be considered by educated investors who can afford to lose all or a substantial amount of their investment. Fees and expenses may offset or exceed profits.
Recommendations
We continue to advocate an elevated level of diversification across asset classes and develop specific asset allocation perimeters that cater to individual risk-tolerance thresholds. In the context of higher yields and the prospect of slower economic growth, Fixed Income assets should command a higher weighting in most portfolios. We also believe that non-traditional asset classes – “real assets” such as real estate and infrastructure, as well as private equity and private credit merit consideration given the real portfolio enhancement opportunities as we transition to a potentially lower growth environment. For investors with a long-term investment horizon, the illiquidity premium in private assets is an attractive source of additional returns. The great news is that private assets, once the sole purview of institutional investors, are gradually being democratized with developments in technology and changes in the regulatory environment.
*May require accreditation.*
