“The most contrarian thing of all is not to oppose the crowd, but to think for yourself.”
~ Peter Thiel
Market Returns & Concentration
The pullback in valuation levels in the Magnificent Seven that we feared in our June 2024 newsletter, began to permeate in the financial markets during July. Recall that we expressed concern about extreme levels of market concentration in Seven stocks – (Apple, Amazon, Microsoft, Meta, Alphabet, Nvidia and Tesla) that drove the S&P 500 and the NASDAQ to strong mid/late teen returns in the first half of 2024. We felt that the strong demand for these stocks was predicated on the premise of strong earnings growth going forward driven by innovative technologies such as Artificial Intelligence. While we believe that the premise is valid long term, we foresaw a higher level of volatility in the interim period. We think the volatility may get higher as data corroborating or calling into question the embedded growth assumptions in the Magnificent Seven develop. We will be on the lookout for just that with corporate earnings releases and the overall growth trajectory of the US and global economy.
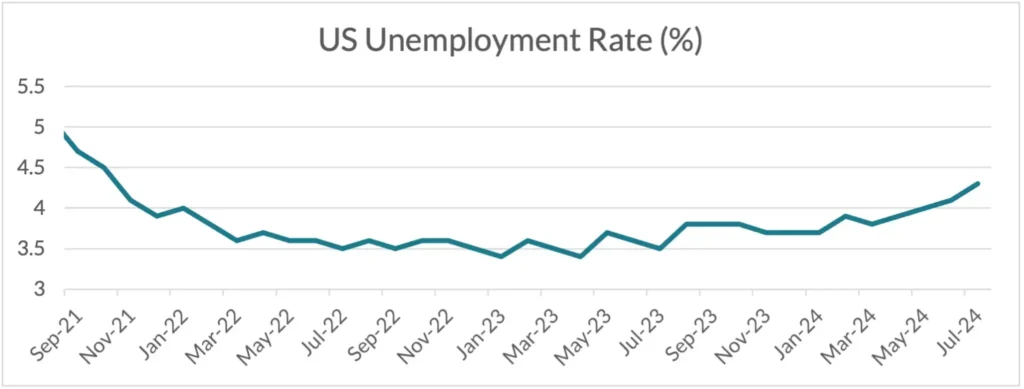
i. Source – US Bureau of Labor Statistics, US Department of Labor, Bloomberg
The trigger for the pullback in growth expectations was the July US employment report that showed US unemployment rising from 4.1% to 4.3%. While the uptick may seem modest, the unemployment rate at the end of 2023 was 3.7%. The upward trend in US joblessness points to a slowing economy with knock-on effects for consumer spending, business investment, and corporate earnings. As such, the markets suffered a steep pullback in the latter part of July (see table below), accelerating sharply following the release of the employment report in early August. While global equities suffered, the impact was the highest on the Tech dominated indexes such as the S&P 500 and the NASDAQ. By contrast, bonds rallied with the prospect of upcoming rate cuts by the US Federal Reserve Bank.
| Index | YTD TR (%) | June 28th-August 5th, 2024 |
|---|---|---|
| US Large Cap – S&P 500 | 11.32% | (3.61)% |
| US Large Cap – Tech Heavy NASDAQ | 9.47% | (7.68)% |
| International Equity – MSACWI ex US | 1.18% | (4.59)% |
| US Small/Mid Cap – Russell 2500 | 2.07% | (0.27)% |
| Bloomberg Aggregate Intermediate Bond Index | 3.17% | 3.90% |
ii. Source – Bloomberg
Magnificent Seven Prior Month & Current Valuations
| Stock | PE Ratio (8/6/2024) | PE Ratio (7/5/2024) |
|---|---|---|
| Apple – AAPL | 31.5x | 35.0x |
| Amazon – AMZN | 38.0x | 54.5x |
| Microsoft – MSFT | 33.8x | 40.4x |
| Meta – META | 23.9x | 27.7x |
| Alphabet (GOOG) | 22.4x | 28.8x |
| Nvidia (NVDA) | 60.7x | 74.0x |
| Tesla (TSLA) | 100.1x | 113.1x |
| S&P 500 | 23.1x | 24.3x |
iii. Source – Bloomberg as of Noon MST 8/6/2024.
The pullback in domestic equity indexes was sharpest in the large cap Big Tech heavy sectors, as concerns over the growth outlook impacted stocks with the highest “priced in” growth valuations. Unsurprisingly, this group is dominated by the Magnificent Seven. While the “sustainable” growth metrics of these companies will continue to evolve, valuations have come down to more reasonable levels compared to just a month ago (see table above). We continue to believe that many of the Magnificent Seven have extremely durable business models and attractive growth prospects. As such, we expect to maintain our positions in certain Magnificent Seven companies in our internally managed, active equity strategies; albeit we reserve the right to alter their weightings as the relative attractiveness of Big Tech against other equity sectors evolve over time.
Stock Returns – A Historical Perspective
S&P 500: CALENDAR YEAR RETURNS
(Highest to Lowest)
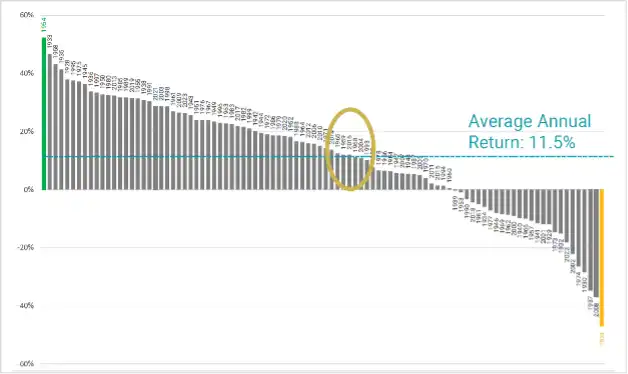
iv. Source/Credit – Bloomberg, Avantis Advisors
Many clients may understandably question whether it is still an appropriate time to remain invested in US equities since there appears to be signs indicating a deceleration of economic growth. We would caution against the impulse of trying to “time the market” in anticipation of sustained pullback, if only because “market timing” also involves reinvesting when one believes that the sell-off is in the proverbial rearview mirror. Getting the timing right on both these decisions is a hazardous task, and the record of market timers is abysmal. Also, the chart above shows annual US large cap equity returns ranked from the highest year to the lowest since 1926 – when index returns were first constructed. The key takeaway is that positive annual returns outnumber negative years by a 3:1 margin. Also, in only seven instances have returns been between +/- 1% of the annual long-term average of 11.5%. Thus, the odds favor investors who remain invested rather than those attempt to time the market. And the cost of getting the market timing decision wrong can be multiples of the average annual return of 11.5%.
Implications
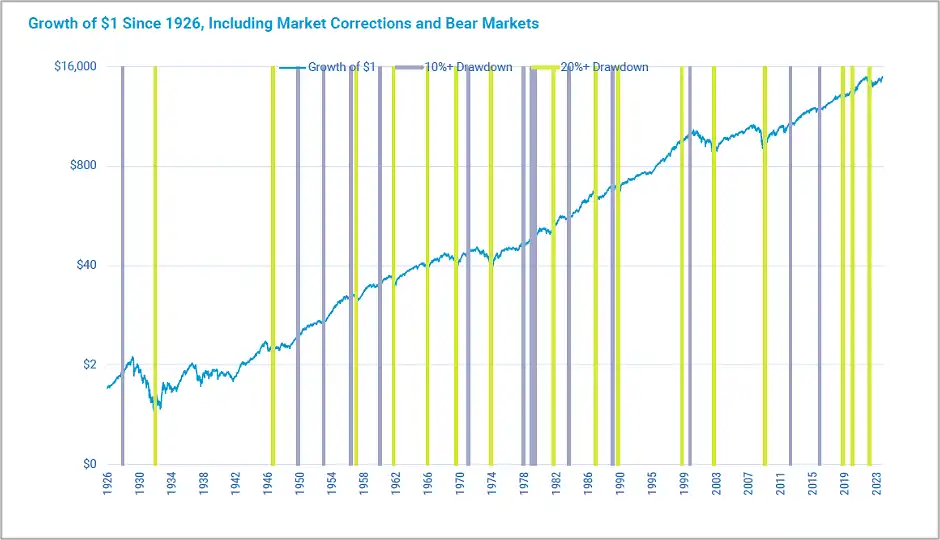
v. Source/Credit – Ken French’s Data Library, Avantis Advisors
While we advocate that our clients remain invested in US equities, we also urge our clients to be honest and realistic about their time horizons. The above chart shows the growth of $1 since 1926, through Market Corrections and Bear Markets (Note the exponential growth.) Also note that there have been two instances where a large drawdown has taken the market a decade or more to achieve a complete recovery. The first was between 1926 and 1942, a period covering the Great Depression. The second period is more recent following the Dot com bust in 1999, and the Global Financial Crisis in 2007, where the S&P 500 only recovered to the previous high-water mark in 2010. The telling lesson is that while the stock market is a great generator of wealth in investment portfolios, investors must have the time horizon to withstand volatility. Thus, even if we experience a sharp correction and a prolonged bear market, we still believe investors will be substantially compensated for equity risk long-term. The only caution we would exercise is that many investors may not have the wherewithal to absorb the volatility and their cash flow needs might necessitate tapping into their portfolios prematurely, thereby monetizing what otherwise would have been unrealized paper losses. For such investors whose time horizon does not span over a decade, we would urge an elevated level of portfolio diversification, combining public equity with more stable fixed income allocations.
Recommendations
As discussed in prior letters, we recommend clients with highly concentrated allocations to large cap US equities consider increasing the weightings of fixed income assets in their overall portfolios. This will help dampen unforeseen volatility. For eligible clients, investments in Private Equity, Real Estate, and Infrastructure through limited private partnerships may help further diversify their asset allocations. And also capture a certain level of uncorrelated returns (alpha) from uncrowded off market deals and various tax- efficient structures.
