“Time arbitrage – taking advantage of the opportunity for long-term profit offered when short-term investors sell due to disappointing short-term macro or business progress – has been a major source of profitability at Pershing Square since the inception of the firm.”
~ Bill Ackman
Equity Valuations and Subsequent Returns

Figures 1-3: Bloomberg, Trajan Wealth Analytics – S&P 500 P/E ratios and returns obtained from Bloomberg. Data series starts 12/1957. Regression analysis performed by Trajan Wealth Analytics
The S&P 500 ended the first half of the year down ( -19.9%), the worst first half performance of any calendar year since 1970. This was triggered by the removal of emergency monetary stimulus measures instituted by the Federal Reserve Bank to support the economy through Covid-19. Persistently elevated levels of inflation forced the Fed into tightening monetary policy.
The Federal Reserve Bank’s Open Market Committee (‘FOMC”) has now raised the target Fed funds rate three times since March, bringing the cost of overnight funds to 1.50% – 1.75% from 0% – 0.25%. Longer dated yields on US Treasury notes increased in tandem with the Fed’s rate hikes. For example, the benchmark 10-year US Treasury note yield rose from 1.51% in January to 3.02% by the end of the 2nd quarter. Increasing interest rates have affected fixed income markets worldwide, culminating in global sovereign bond market performance since 1865! Meanwhile, bond investors in the United States have suffered a (-10.4%) pullback in core Investment Grade fixed income portfolios, negating the traditional premise of cross-asset class diversification. However, rising interest rates have increased risk premiums by dampening valuation levels in both the equity and credit markets. While not calling a bottom, we feel markets have cheapened enough to offer investors compelling market entry prospects.
A common valuation measure in the equity markets is the prevalent P/E ratio, which is simply the multiple of current earnings that an investor pays to acquire a stock or portfolio of stocks. The stock price is simply the discounted present value of expected future earnings. As depicted in the chart above (Figure 1.), the current P/E ratio on the S&P 500 is 16.6x current, full year earnings. This level is slightly below the S&P 500’s long-term average of about 17.0x. However, the rate used to discount future earnings is, to a substantial extent, based on the prevailing risk-free rate of interest, proxied by the yield on US treasury notes. At the time of this writing, the yield on the 10-year US Treasury is about 3.0%, substantially lower than its long average of 5.9%. Thus, with substantially lower discounting of future earnings, the P/E multiple on the S&P 500 today is nearly equivalent to its long-term average!
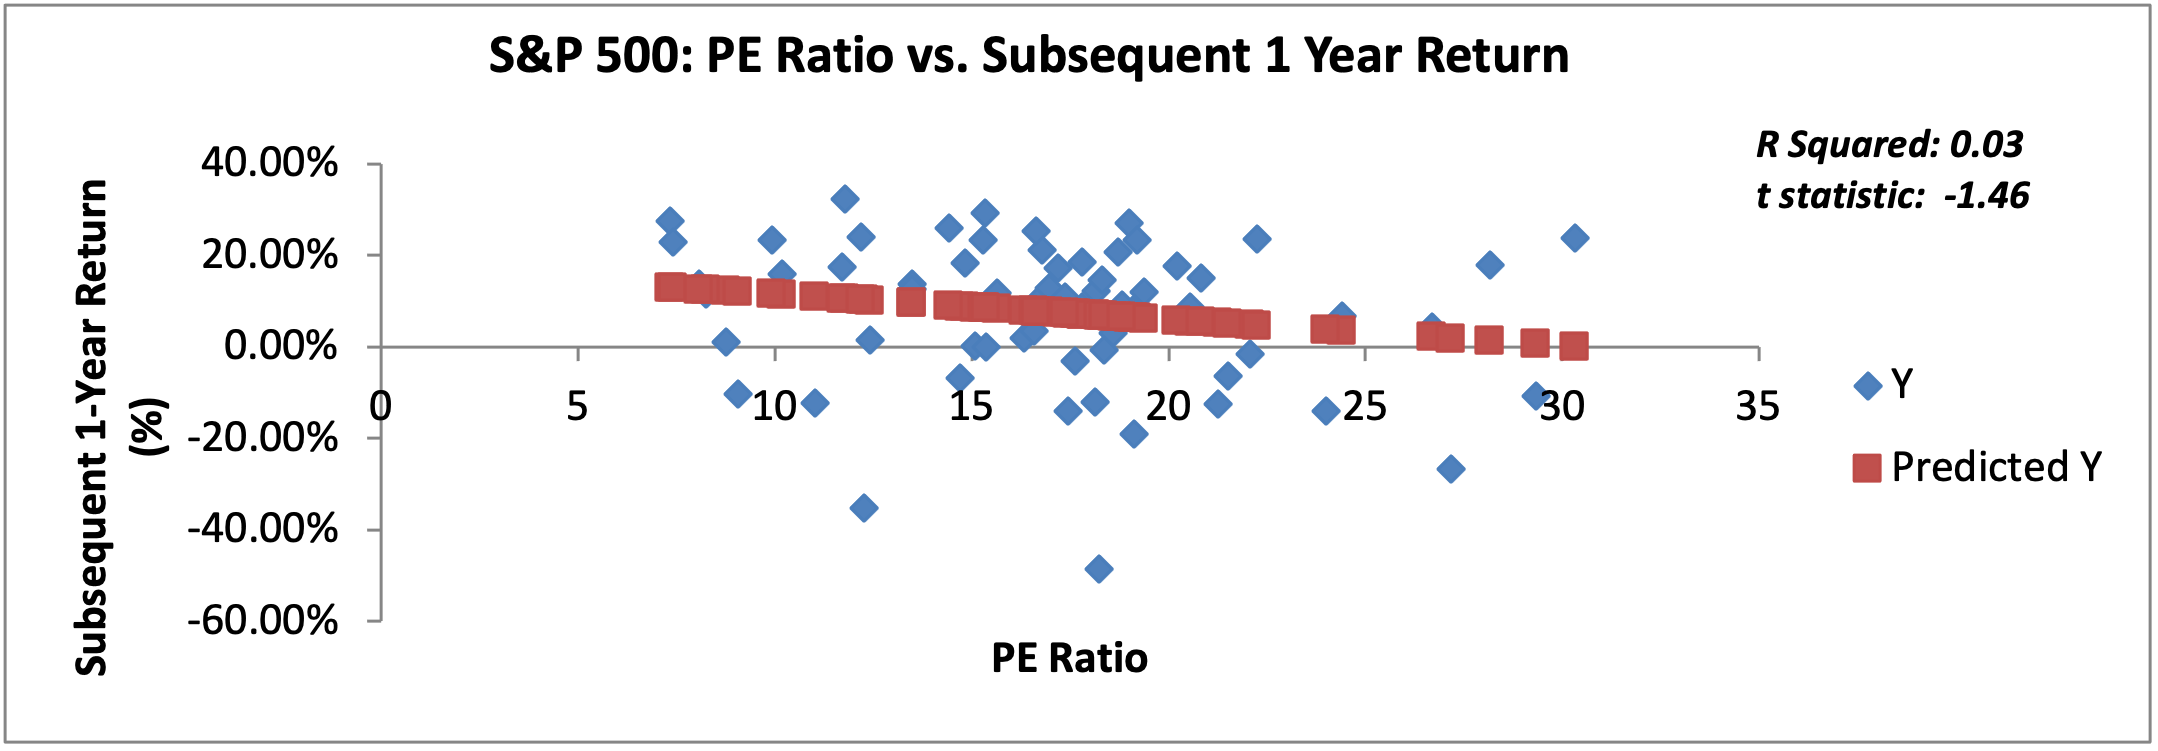
Fig. 2: Bloomberg, Trajan Wealth Analytics

Fig. 3: Bloomberg, Trajan Wealth Analytics
However, the pertinent question for investors is whether entry valuation levels have any predictive power for subsequent equity or equity market returns? Simply, do valuations matter? The above two diagrams help practitioners like Trajan Wealth answer that questions. The first chart shows historical valuation levels on the S&P 500 at the end of every year since 1957, regressed against the subsequent 1-year return. The predictive power is negligible – about 3% and the relationship is not statistically significant. The second chart shows the same P/E time series regressed against the subsequent 5-year annual average returns. The predictive power increases to 8%, and the relationship becomes statistically significant.
Implications
Valuations do indeed matter, particularly over longer-time time horizons. This is intuitively obvious. Cheaper entry prices should yield better longer-term investment outcomes as future earnings are earned over a relatively lower level of the initial investment. However, other factors apart from current valuation levels impact future returns. That includes the upward/downward surprises in the realized growth of future revenues and profits, developments in the competitive landscape, and consistency of management effectiveness, to name a few. As such, entry valuation levels, while significant, is not a perfect indicator of subsequent investor returns, but has some predictive usefulness – our analysis shows the predictive power at about 8%. This is not immaterial. Any one factor that explains 8% in the variation of future returns makes a compelling case for investor consideration.
As investment professionals, we at Trajan Wealth believe that many assets look “cheap” following the sustained selling activity witnessed in the first half of 2022. While the present value of future earnings is lower due to higher interest rates, long-term growth prospects in many businesses remain compelling. Well-capitalized (low debt) businesses with stable to growing operating metrics are available at attractive levels. Our team at Trajan Wealth is working diligently to identify, analyze and invest in exactly those businesses.
What About Inflation?
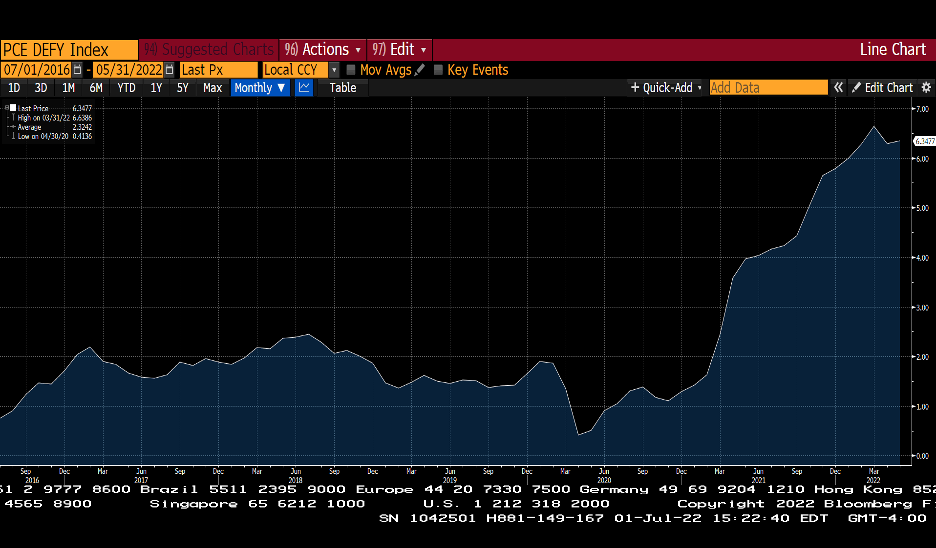
Fig. 4: Bloomberg – US Personal Consumption Deflator
Readers may legitimately critique our rich-cheap analysis on the S&P 500 on the premise that it ignores the prospect of accelerating inflation, which, if realized, will almost certainly put further upward pressure on interest rates. While predicting interest rates is a hazardous exercise, we acknowledge that inflation, and expectations of future inflation, are key determinants. While inflation has remained persistently higher than the FOMC’s 2% target since the summer of 2021, there are some signs that the economy may be at an inflection point concerning the rate of change of inflation. The above chart depicts time series readings of the FOMC’s preferred gauge of inflation – the Personal Consumption Inflation Deflator (“PCE Deflator”). After the steep spike in monthly readings since last summer, the past couple of readings show a reversal of the accelerating trend, and the key price indicator appears to have flatlined. This is consistent with a sharp reversal in many commodity prices and an easing of crucial crude oil prices during June. To be sure, at 6.3%, the PCE Deflator remains well above the Fed’s 2% target. Still, we believe that any reversal of the accelerating trend will keep expectations of future inflation constrained.
Inflation Expectations
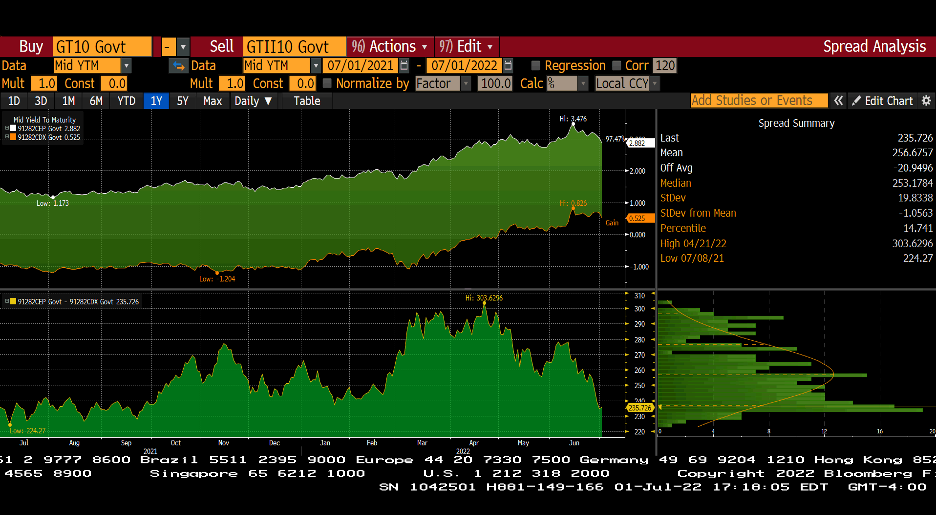
Fig 5: Bloomberg – Yield differential between 10-Year US Nominal and Inflation-Protected Treasury note
While past readings are history, the market’s expectations for future inflation can be gauged by following the yield spread between US nominal Treasury notes and US inflation-protected Treasury notes. In the latter, the US compensates investors for future inflation – thus, inflation-protected Treasury securities have a lower yield/coupon interest relative to nominal Treasury notes. The yield difference between nominal and inflation-protected US Treasury notes in the forward expectation for inflation. Looking at the 10-year spread between the two notes, the market is pricing an average inflation rate of 2.4% over the next 10 years, lower than the 2.9% inflation that the US has experienced since 1900. Furthermore, to provide some proof on our view that both inflation and inflation expectations may have already peaked, the forward expectation of inflation has fallen from its high point last April when the reading crossed 3%, and 1st quarter of US GDP showed a negative reading during the first quarter of 2022. This suggests that growth is sharply decelerating. In summary, the gradual restoration of supply chains combined with a dampening of overall economy-wide demand due to higher borrowing costs is slowly bringing inflation under control.
Recommendations
We continue to advocate active participation in the financial markets and urge our clients to stay disciplined and focused on their long-term financial goals. As investment practitioners, we also advocate diversification across asset classes in line with individual risk-tolerance thresholds. For investors with relatively long-term investment horizons, we suggest a sizeable allocation to equities as it remains the asset class best suited to enhancing long-term purchasing power. For investors with somewhat shorter time horizons, allocations to bonds and other income-producing assets – for example, commercial real estate, is an appropriate risk reduction measure in an overall investment portfolio.
UDAYAN MITRA, CFA
Trajan Wealth Chief Investment Officer