“The stock market is the story of cycles and of the human behavior that is responsible for overreactions in both directions.”
~ Seth Klarman, Investor. CEO, Baupost Group
Market Returns
The US financial markets have been roaring since the start of 2023, with both stocks and bonds posting strong returns as of the end of June 2023 (see table below). Even trailing 1-year returns are in strong positive territory in the broad US large-cap equity markets, while investment-grade bonds are now down only 0.94% over the course of the past year. Small/Mid cap US stocks have also staged an impressive comeback over the past two months, with both YTD and 1-year returns now looking impressive, and international stocks are showing a similar effect as commodity prices ease and inflation starts to trend lower.
| Index | YTD TR (%) 6/30/2023 | 1 Year TR (%) 6/30/2023 |
|---|---|---|
| US Large Cap – S&P 500 | 16.88% | 19.56% |
| US Large Cap – Tech Heavy NASDAQ | 32.32% | 26.17% |
| International Equity – MSACWI ex US | 9.86% | 13.37% |
| US Small/Mid Cap – Russell 2500 | 8.78% | 13.55% |
| Bloomberg Aggregate Intermediate Bond Index | 2.09% | (0.94)% |
The appreciable recovery in the financial markets coincides with the severest interest rate tightening cycle implemented by the Federal Reserve Bank over the past 40+ years. Remember that rising interest rates usually function as a detractor to both stock and bond performance – stocks because future corporate earnings are discounted at higher rates and corporate profitability is challenged by higher debt servicing costs, bonds because fixed coupons are discounted by higher rates. However, as the Fed progressively increased short-term overnight rates, longer-term interest rates started to fall (particularly since 4Q 2022) in anticipation of an eventual slowdown in economic growth. In essence, the bond market is now “fighting the Fed” – essentially pricing in a significant possibility of a recession.
Lower long-term interest rates have two counterbalancing effects: (1) First, its signals lower growth/inflationary pressures going forward, suggesting compression in the growth rate of corporate earnings. Offsetting the “headwind” effect of lower earnings growth, lower long-term rates also (2) reduce the discount factor used at which long-term projected earnings are discounted, generating a “headwind” for stock prices. While not in the business of predicting future returns, we are closely monitoring the two countervailing forces and building it into our security selection. At this juncture, we believe overweighting companies with low debt and a certain degree of differentiation and non-cyclicality in the nature of their products is the prudent way to allocate capital.
Private Markets
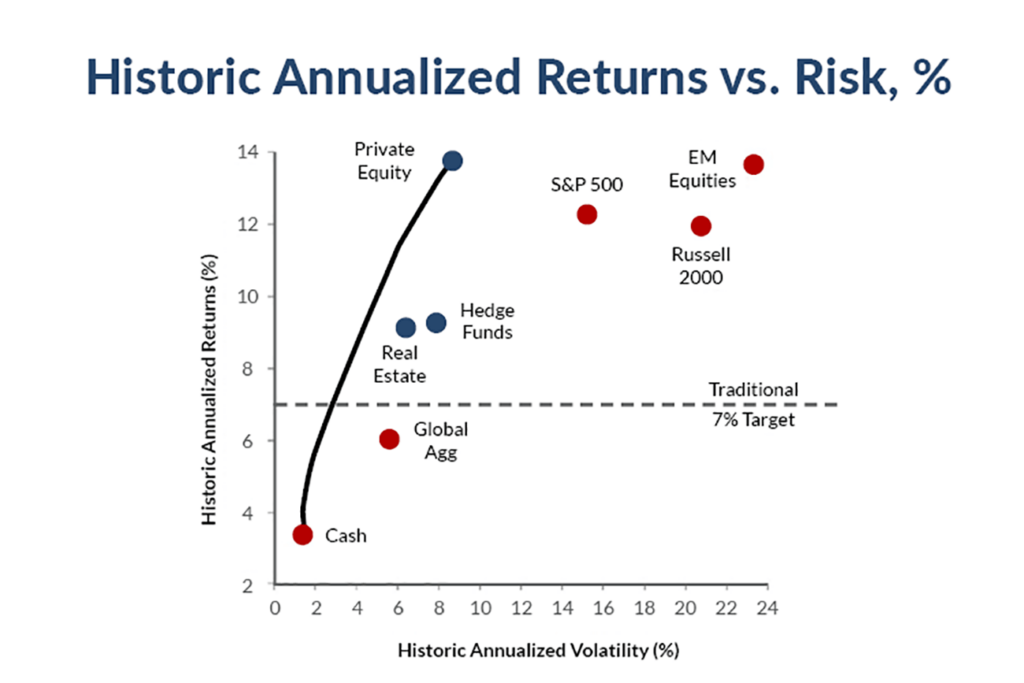
Note: From 1Q86 to 4Q20, where data is available, deemphasizing 2008 and 2009 returns at one-third the weight due to the extreme volatility and wide range of performance, which skewed results. Using MSCI AC World USD for Listed Equities; Barclays Global Agg Total Return Index Unhedged USD for Fixed Income; Cambridge Associates Global Private Equity for Private Equity; HFRI Fund Weighted Composite Index for Hedge Funds, and Barclays US T-Bills 3-6 Months Unhedged for Cash. Source: Bloomberg, MSCI, Cambridge Associates, KKR Global Macro & Asset Allocation analysis.
Some might ask, can our methodology of security selection, painstaking as may be, really make a discernible difference when investing in the public markets? After all, investing in the public markets involves investing in public securities, for which every investor has access to the same information (company filings, corporate press releases) at the same point in time (corporate filing dates, earnings call schedules). In fact, it is manifestly illegal to trade upon material non-public information, howsoever acquired. At Trajan Wealth, we not only understand this type of healthy skepticism, but we welcome it. Our focus on attempting to outperform underlying strategy benchmarks is not based on the belief that we are intrinsically “smarter” than other managers; instead, we rely on discipline and a steadfast belief in thinking long-term and analyzing business models rather than reacting to unexplainable price movements. Neither do we think our steadfast approach gives us a superlative “edge.” We fully recognize that the performance difference between “top decile” and “average managers” in the public equity markets barely averages 300 basis points. That said, we think if we can consistently outperform by about 150-200 basis points through market cycles, we can significantly enhance our clients’ investment outcomes through the process of incremental compounding.
With regard to overall asset allocation, we at Trajan Wealth also believe that we can significantly enrich our clients’ investment outcomes by prudently allocating portions of their long-term investment portfolios toward private assets*. Briefly, private assets are assets that are not traded in the public markets and include: Private Equity, and debt; Private Credit of private companies; Private Commercial Real Estate; and Private Infrastructure Funds (pools of capital invested in private infrastructure projects) – to name a few. Being private assets, these asset classes are significantly illiquid, taking as much as a decade for the return of and the returns on invested capital. However, they tend to command a veritable and persistent illiquidity premium, and since valuation changes only reflect changes in durable changes in earnings and cash flow (rather than machine trading, trend flowing, leveraged trading, short-interests, short squeezes, memes!), price volatility is considerably lower than assets traded in the public markets (see chart on page 2). While private assets were organized as private partnerships and previously open only to institutional investors and eligible qualifying investors, the sector is gradually getting democratized. We at Trajan are actively participating in the democratization of the Private Markets and building a portfolio of offerings for our clients.
Recommendations
We continue to recommend diversification across asset classes based on your risk tolerance and individual financial circumstances. Trajan Wealth has developed models with risk levels from conservative to aggressive, and clients should consult with their advisor and the Portfolio Management Group when choosing the appropriate asset allocation. In the context of higher yields and the prospect of slower economic growth, Fixed Income assets should command a higher weighting in most portfolios. Trajan Wealth’s investment team maintains its distinctive, high-quality bias within asset classes. We also believe that non-traditional asset classes – “real assets” such as real estate and infrastructure, as well as private equity and private credit merit consideration given the real portfolio enhancement opportunities as we transition to tightening monetary policy environment. We also expect elevated levels of market volatility going forward, if only due to rapidly rising financing costs that may adversely affect economic growth and corporate profits. As such, absolute return strategies – trend following and equity/credit market dispersion, which benefits from volatility may be appropriate for certain investors in an overall asset allocation. We continuously look for these unique sources of returns for our clients and will make recommendations as we develop additional strategies and update our asset allocation models.
*Investment in private equity may require accreditation.*
