“The problem with interest rates are that you are not modeling a single number, you are modeling a whole term structure, so it is a sort of different type of problem.”
– John Hull, Professor of Finance, University of Toronto
Market Returns & Outlook
Coming off a superlative 2023, upward momentum in the global equity markets showed no signs of dissipating in the first quarter of this year. YTD returns on domestic equities range from 6.92% in small and mid-cap stocks to a whopping 10.55% in the S&P 500. Encouragingly, the equity market rally seems to be broadening beyond technology stocks as illustrated by the relatively stronger performance of both Small & Mid Cap stocks and the broad based S&P 500 versus the tech heavy NASDAQ Composite in the month of March. Bond returns have started to recover with dovish language emanating from the US Federal Reserve Bank on the future direction of monetary policy.
| Index | YTD TR (%) | March 2024 |
|---|---|---|
| US Large Cap – S&P 500 | 10.55% | 3.22% |
| US Large Cap – Tech Heavy NASDAQ | 9.32% | 1.85% |
| International Equity – MSACWI ex US | 4.82% | 3.21% |
| US Small/Mid Cap – Russell 2500 | 6.92% | 4.13% |
| Bloomberg Aggregate Intermediate Bond Index | (0.78)% | 0.92% |
US Inflation Adjusted Fed Funds Rate
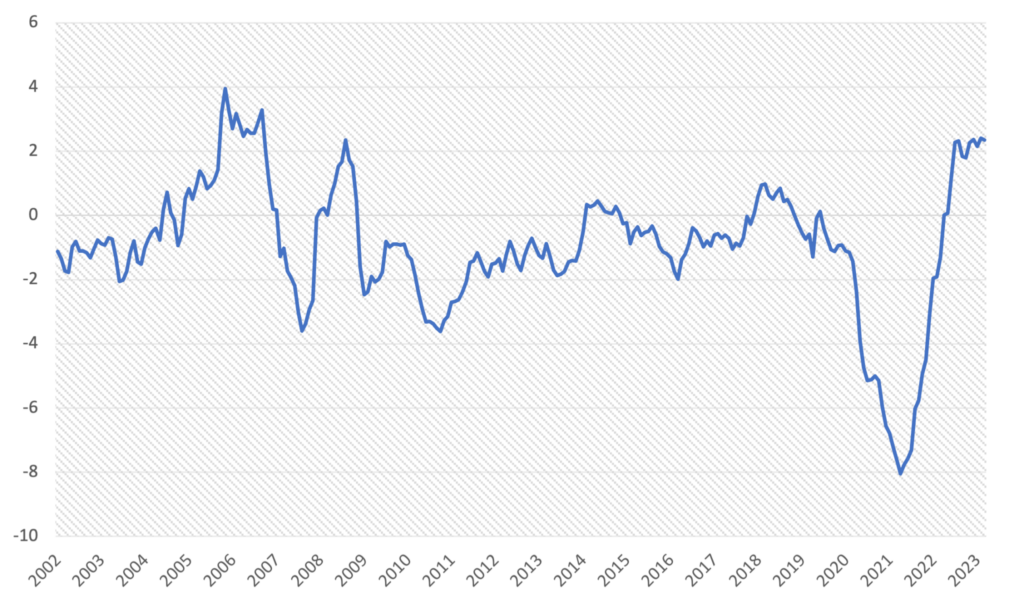
Chart 1. Source: Bloomberg
On the subject of monetary policy, most of our readers/clients may be aware of the prevailing market view that the next move by the Federal Reserve Bank’s Open Market Committee (“FOMC”) will be a reduction in the overnight Fed Funds rate. Indeed, Fed Chairman Powell has indicated that the FOMC may be open to reducing the Fed Funds rate even before inflation reaches the Fed’s 2% target. As illustrated in chart 1 above, the “real” Fed Funds rate is now over 2% – meaning that the current overnight rate of 5.25% to 5.50% is running over 2% higher than inflation, as measured by the Fed’s preferred Personal Consumption Expenditure Deflator (“PCE Deflator”). The PCE Deflator indicates that inflation is now running at close to 3%.
With real interest rates now positive after almost five years and at its highest level since the Great Financial Crisis of 2008/09, the Fed has room to reduce the overnight rate – the market anticipates rate cuts of between 0.50% to 0.75% by the end of the year. While this may cheer the markets and extend the rally temporarily, we still urge caution because we believe longer term rates, based on US Treasury bond yields, will remain under pressure throughout the next cycle.
US Treasury – Yield Spread between 10 and 2 year notes
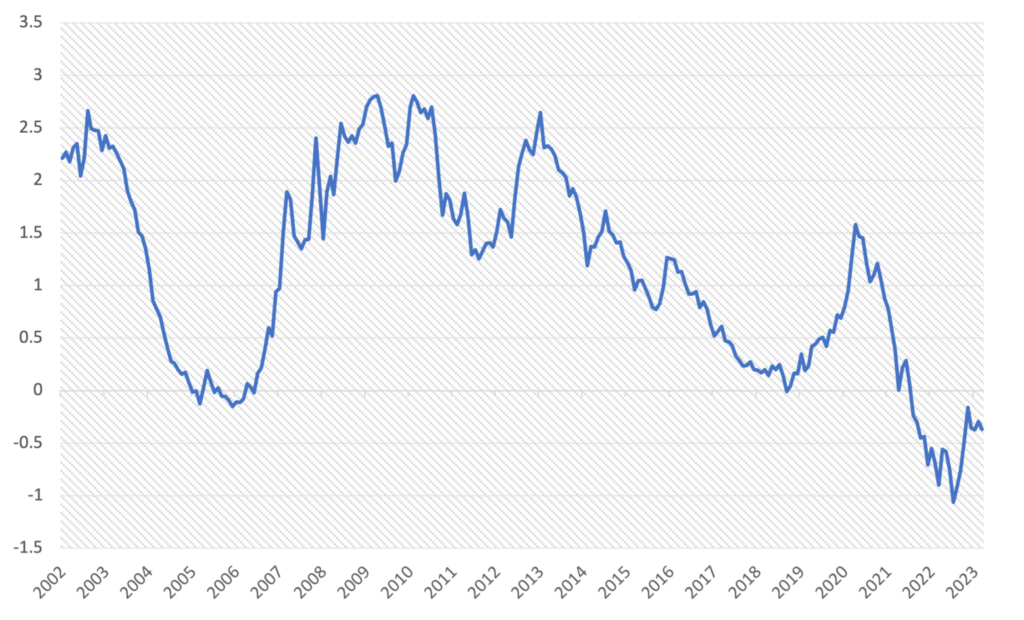
Chart 2. Source: Bloomberg
Speaking of longer-term interest rates, the above chart illustrates the yield spread between 10-year and 2-year maturities of US Government issued Treasury notes. Note, the average yield difference is over 1%. Currently, the yield curve is inverted, and shorter – 2-year yields are actually higher than longer 10-year yields. Thus, even though the Fed might reduce overnight rates, it is prudent to assume that while short terms rates respond to the Fed rate cuts, longer term yields many remain range bound around current levels and may even trend higher if inflation remains sticky over the FOMC’s 2% target, or the US Treasury keeps issuing bonds to finance the Federal government’s persistent budget deficits – see chart 3 below.
US Federal Budget Deficit as Percentage of GDP
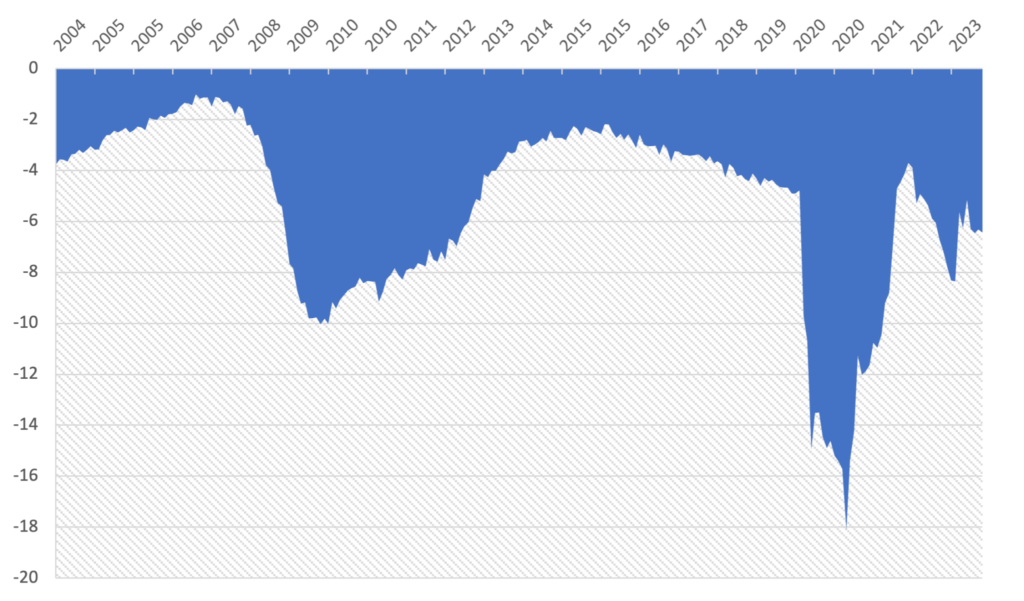
Chart 3. Source: Bloomberg
Implications
The combination of rapidly growing debt at the Federal Government level, makes us at Trajan Wealth cautious on the level of intermediate and long-term interest rates, which is the benchmark for borrowing costs across much of Corporate America and equally significantly, for the commercial and residential mortgage markets. Now it is worth repeating that while the Federal Reserve Bank’s Open Market Committee (“FOMC”) has control and indeed discretion over overnight money market rates (commonly known as the Fed Funds Rate), yields in the bond market are determined by investors, partly based on the supply and demand of debt. In the absence of any evidence of fiscal discipline by our policy-makers – as evidenced by sustained deficits over the course of the last 20+ years, we at Trajan Wealth believe the days of sub 2% yields on %-year and 10-year notes are firmly behind us. The risk that we are concerned about centers on the need for borrowers to refinance debt that was taken a decade earlier and matures in the next 1-5 years going forward. Not only will borrowers face reality of much higher borrowing rates, but lenders may also insist on more collateral (pertinent in the Commercial Real Estate and secured Corporate Lending sectors) in future transactions; effectively forcing borrowers to pledge more equity or “skin in the game” as a condition for financings. The combination of higher borrowing costs and lower levels of leverage makes our outlook for future asset returns a lot more measured relative to the superlative returns experienced during the “easy money” period between 2009 and 2022.
Recommendations
We continue to advocate an elevated level of diversification across asset classes and develop specific asset allocation perimeters that cater to individual risk-tolerance thresholds. In the context of higher intermediate and long-term bond yields and the prospect of slower economic growth, high quality but moderate duration fixed Income assets should command a higher weighting in most portfolios. With interest rates projected to be higher in the next cycle compared to the past, we believe there is a large possibility of “repricing” in certain interest rate sensitive sectors. High quality income producing assets – certain commercial real estate sectors and perhaps infrastructure type assets may be available at dislocated prices offering attractive entry opportunities. We are actively seeking out these opportunities as they help reduce the duration of client portfolios through higher cash flow while dampening overall volatility. In terms of public equity, we at Trajan Wealth will maintain a bias towards companies with low debt and stable sources of revenues. In terms of mapping out optimal strategies for our clients who span the spectrum in terms of risk tolerance levels and applicable investment time horizons, we would highly recommend our clients to reach out for a portfolio review to ensure asset allocation and financial goals remain in alignment.
