“When you develop your opinions on the basis of weak evidence, you will have difficulty interpreting subsequent information that contradicts these opinions, even if this new information is obviously more accurate.”
~ Nassim Nicholas Taleb
Year To Date Returns in Context:
Likelihood Distribution of S&P 500 Returns Based on Historical Averages For Risk & Reward
As we approach the end of the 2nd Quarter, it makes sense to recap YTD performance by asset class and approach the future with both practicality and discipline, mindful of our constituents’ long-term investment objectives.
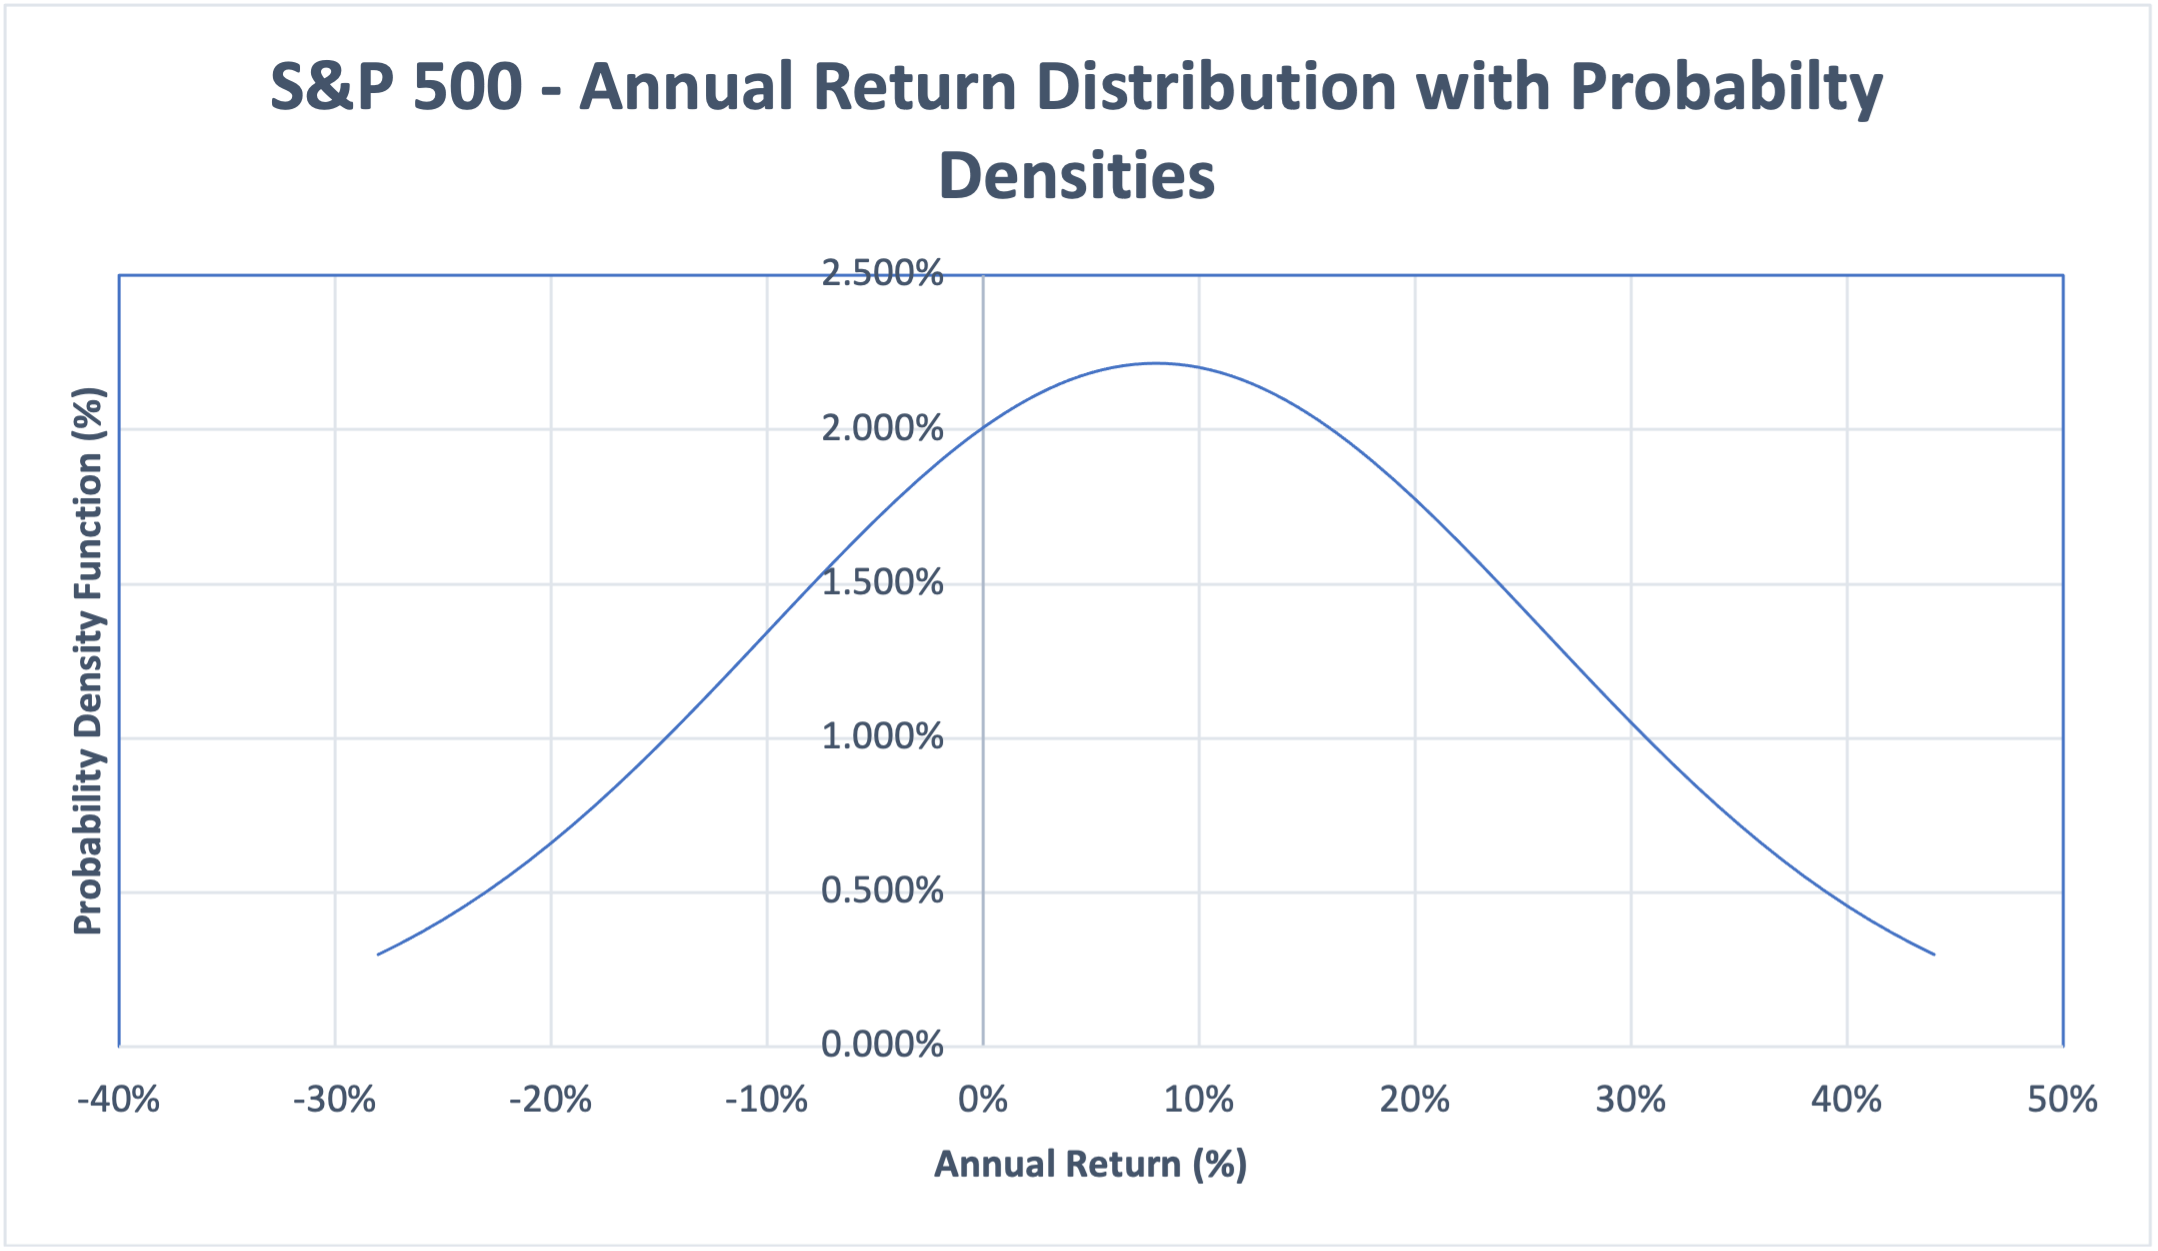
Fig. 1: Bloomberg – S&P 500 Returns/Std Deviation

Broad US Equities proxied by the S&P 500 are down (12.7) % YTD after suffering a maximum drawdown of over (17.6) % during the year. In a similar vein, the tech-heavy NASDAQ is currently down (22.5) %, recovering from a max drawdown of (27.7) % in 2022. The equity sell-off has been global – the MSCI Ex USA Global All-Cap World Index is down (10.7) %, recovering once gain from a max drawdown of (17.2) %. The main factor behind the sell-off in equities has been rising US interest rates; a phenomenon that led to sharp sell-offs in the US bond markets; both investment grade and high yield as depicted by the respective Barclays Capital indexes in the above table.
The key question is what lies ahead? While forward predictions are a notoriously hazardous exercise, it seems best to put some context to the current equity market performance. Since the inception (in current form) of the S&P 500 index in 1957, annual US Equity market returns have averaged about 8%. Annual volatility, a measure of the dispersion of the average return has been about 18%. Putting these inputs into a standard bell-curve distribution, the current drawdown is certainly not unusual; in fact, losses of up to 13% could happen once every 5 years. Considering that the proceeding five-year annual return averaged +17.7% at the end of 2021, the current correction is certainly within the purview of statistical possibilities. Furthermore, from a valuation perspective, the S&P 500 is currently trading at the Price/Earnings (P/E) multiple of 18x, marginally higher than its long-term average of 17x. Therefore, we certainly would advise investors to “stay the course.” An average long-term return of 8% doubles investor capital in less than 10-years; also, the “win probability” of remaining invested in the equity markets exceeds 70% over the long term. While stock returns do not fit neatly into a bell curve distribution, the patterns are sufficiently close to derive substantial inference. The alternative strategy to “staying the course” is market timing….
Futility of Market Timing
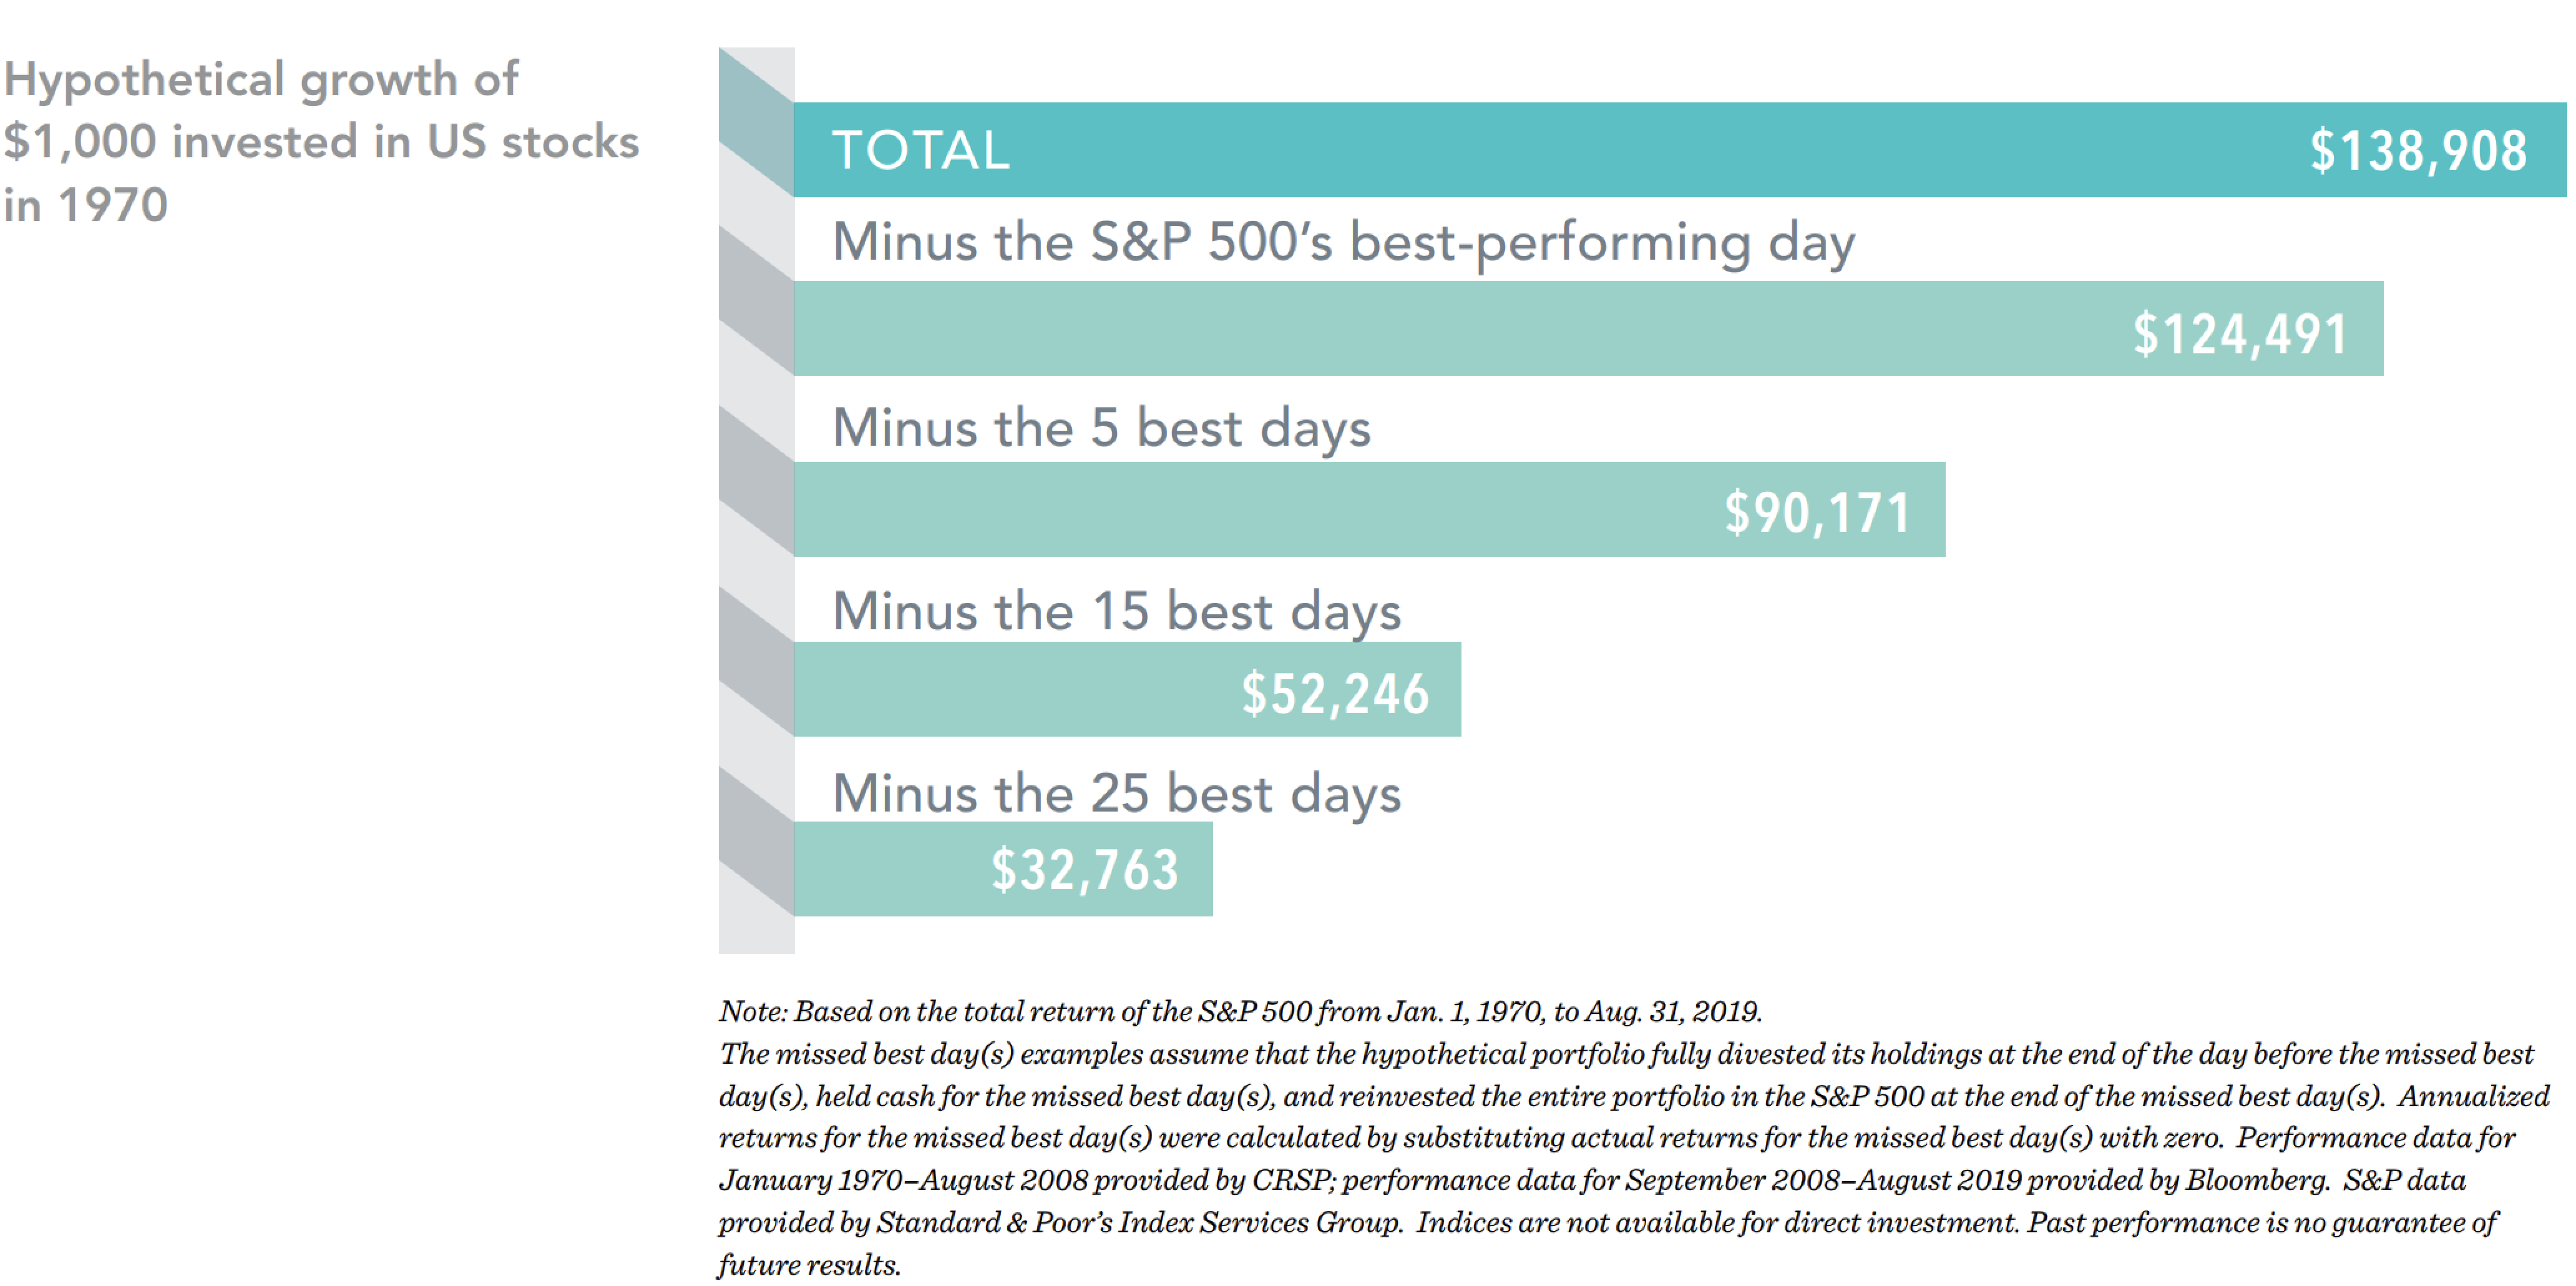
Fig. 2: Bloomberg – Courtesy Bloomberg columnist, John Authers
Market timing, simply put is a strategy-driven to exit the market on the perception of accelerating future losses, and re-entering on the perception that the market has “bottomed.” While sounding intuitively attractive, the efficacy of market timing is predicated on getting two decisions correct – (1) the market does indeed experience sizeable sell-off upon exit and (2) picking the market “bottom” correctly during reentry. The above table illustrates the adverse impact of getting the second decision wrong. A $1k dollar investment in the S&P in 1979 would be worth $138.9k if investors simply withstood all the volatility and stayed the course. A market timing strategy that failed at picking the bottom and missed key days would look as follows:
- $124.5k if the investor missed the best performing day
- $90.2k if the investor missed the best five days
- $52.2K if the investor missed the best fifteen days
- $32.8k if the investor missed the best twenty-five days
This is particularly relevant because equity and bond markets bottomed out during in the first three weeks of May in 2022 before rallying sharply going into month-end. This illustrates that market inflections can happen in brief time intervals before any tangible changes in investor sentiment. As such, Trajan Wealth recommends a high degree of caution for any client contemplating a market-timing approach to either asset allocation or overall investing. In our view, market timers are highly likely to get at least one, if not both decisions that underpin a market timing strategy completely wrong.
What About Inflation?
Inflation Expectations

Fig. 3: Bloomberg – Yield differential between 10-Year US Nominal and Inflation-Protected Treasury note
As mentioned in our previous market updates, interest rates have been increasing across all maturities in 2022 in response to the Federal Reserve Bank’s increased focus on tightening monetary policy to combat inflation. While most inflation readings are high relative to the Fed’s inflation target, there are signs that inflation has stabilized with little risk of further acceleration. While past readings are history, the market’s expectations for future inflation can be gauged by following the yield spread between US nominal Treasury notes and US inflation-protected Treasury notes. In the latter, the US compensates investors for future inflation – thus inflation-protected Treasury securities have a lower yield/coupon interest relative to nominal Treasury notes. The yield difference between nominal and inflation-protected US Treasury notes is the forward expectation for inflation. Looking at the 10-year spread between the two notes, the market is pricing an average inflation rate of 2.7% over the course of the next 10-years, slightly lower than the 2.9% inflation that the US has experienced since 1900.
Asset Class Returns vs. Inflation
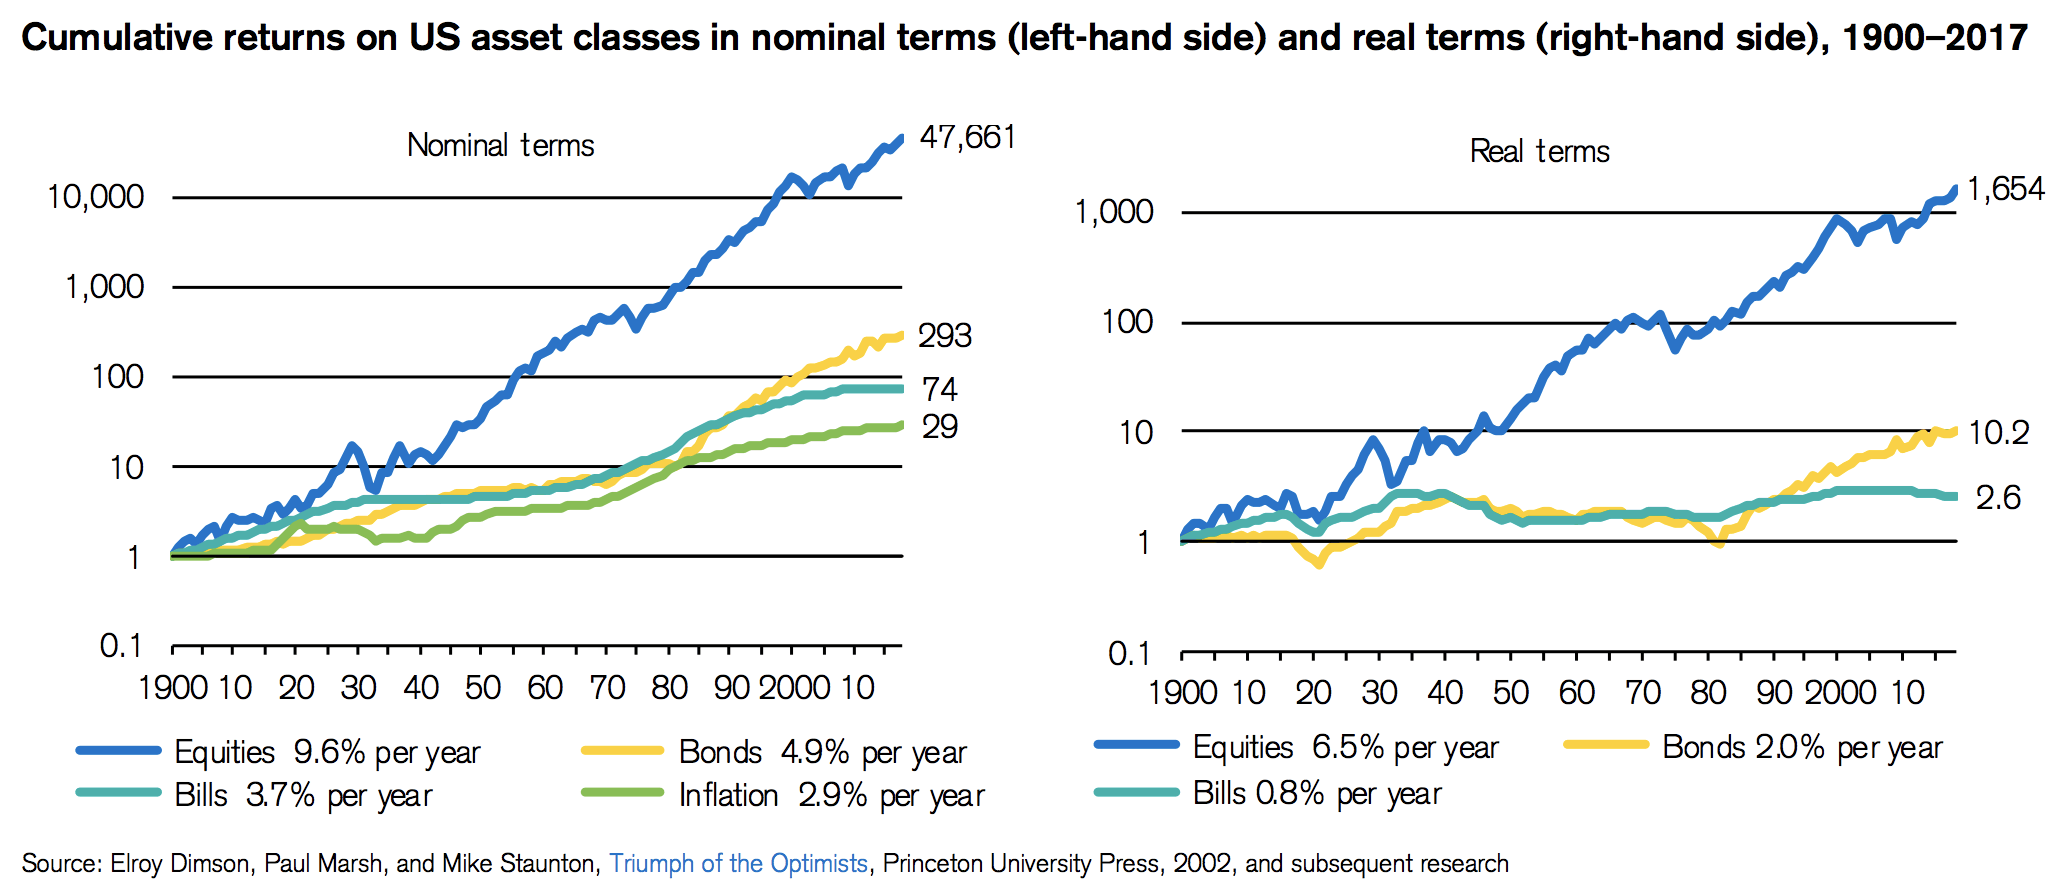
Fig. 4: Elroy Dimson, Paul Marsh, and Mike Staunton, “Triumph of Optimists.” Princeton University Press
As market practitioners’ projection for future US inflation is broadly commensurate with the US long-term annual average, it seems timely to gauge what asset classes have historically enhanced purchasing power after adjusting for inflation. The above chart depicts the US experience since 1900. Adjusted for inflation, a $1 investment in the US Equity market would be worth $1,654 today, in spite of periodic pullbacks in US equity market performance in the immediate aftermath of a steep spike in broad-based prices. The mid-1970s and early 1980s are recent representative examples of these pullbacks. However, as both monetary policy and markets adjust, equity returns trend toward long-term averages – 8% to 10%, depending on market capitalization categories. Comparative, inflation-adjusted returns on bonds and cash for a $1 invested in 1900 amount to $10.2 and $2.6, respectively.
Recommendations
We continue to advocate active participation in the financial markets and urge our clients to stay disciplined and focused on their long-term financial goals. As investment practitioners, we also advocate diversification across asset classes in line with individual risk-tolerance thresholds. For investors with relatively long-term investment horizons, we suggest a sizeable allocation to equities as it remains the asset class best suited to growing long-term purchasing power. For investors with relatively shorter time horizons, allocations to bonds and other income-producing assets – for example, commercial real estate, is an appropriate risk reduction measure in an overall investment portfolio.
UDAYAN MITRA, CFA
Trajan Wealth Chief Investment Officer
