“Financial peace isn’t the acquisition of stuff. It’s learning to live on less than you make, so you can give money back and have money to invest. You can’t win until you do this.”
~ Dave Ramsey
Market Returns & Outlook
They say profits are the “mother’s milk” of stock performance and strong Q1 2024 earnings in the US eased the fears that higher borrowing costs are significantly cooling the economy. Furthermore, conciliatory language by Fed Chairman Jerome Powell following the May 1st FOMC meeting seems to have reassured the markets the next Fed move will be to cut overnight rates. Markets across the globe rebounded sharply in May as fears of accelerating bond yields subsided. YTD returns on domestic equities range now from 3.32% in small and mid-cap stocks to 11.82% in the NASDAQ. Bond returns have started to recover as yields across all maturities trended lower with the Fed’s dovish posture.
| Index | YTD TR (%) | May 2024 |
|---|---|---|
| US Large Cap – S&P 500 | 11.20% | 4.96% |
| US Large Cap – Tech Heavy NASDAQ | 11.82% | 6.98% |
| International Equity – MSACWI ex US | 6.10% | 2.98% |
| US Small/Mid Cap – Russell 2500 | 3.32% | 4.16% |
| Bloomberg Aggregate Intermediate Bond Index | (1.64)% | 1.69% |
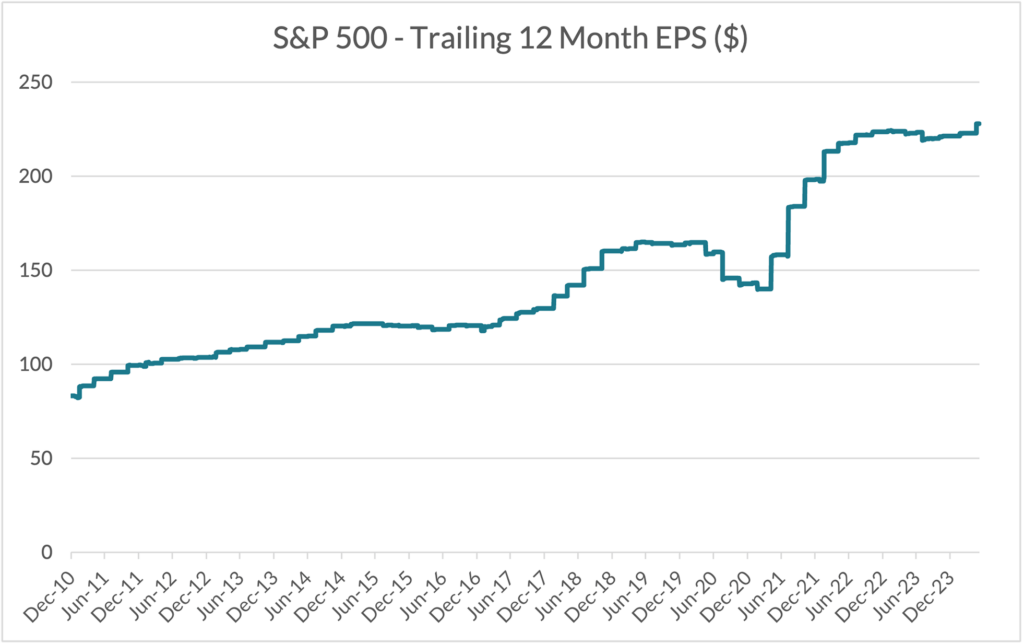
Chart 1. Source – Bloomberg
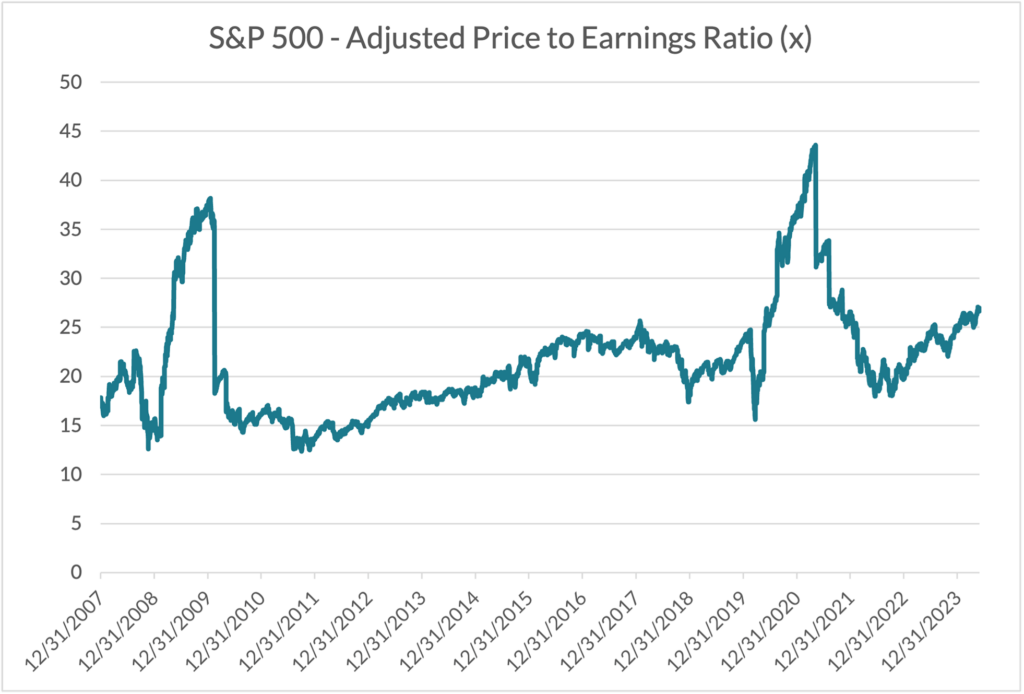
Chart 2. Source – Bloomberg
Corporate earnings – see chart 1, in the US, large cap stock space continues to grow sharply, driven by exponential demand for the backbone infrastructure required to power the expected Artificial Intelligence (“AI”) revolution. Indeed, chip designer NVIDIA Corp.’s stock is up a whopping 141% YTD at the time of this writing, fueled by trailing 12-month revenue growth of ~208% and EPS growth of ~690%. In a similar vein, Big Tech companies with the infrastructure to capture a massive amount of data – Microsoft, Meta, Alphabet and Amazon, have posted strong double digit YTD returns. The performance outside Big Tech and the companies underpinned by AI are more modest on a relative basis, continuing earlier trends of a concentrated market where a handful of stocks keep driving overall index returns.
Another cautionary note for future stock market performance is the current level of valuation as measured by the S&P 500 Price Earnings (P/E) ratio – see chart 2. At the current level of just above 25x, the market is trading significantly above its long-term average of approximately 19x. Valuation levels are in part contingent on interest rates and inflation expectations, suffice to say the future trajectory of long-term bond yields will impact stock performance as valuation levels adjust to changing realities.
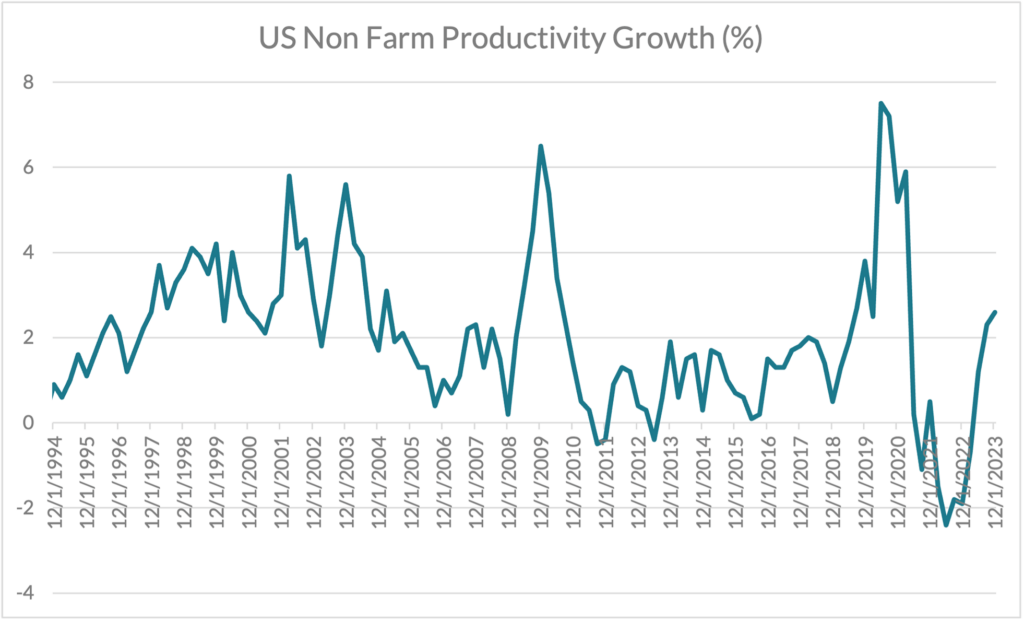
Chart 3. Source – Bloomberg
As we discussed last month, the confluence of faster computing power, AI, comprehensive data science techniques, and advanced robotics, appears to have increased worker productivity (see US Non-Farm Productivity chart – year 2018 through 2020) to levels well higher than the 2% long-term average, with the Covid-19 related lockdowns being an aberration. Post the Covid-19 disruptions, productivity is accelerating sharply once again as more companies deploy advanced technologies to stay competitive. This bodes well for future EPS growth.
US Demographics
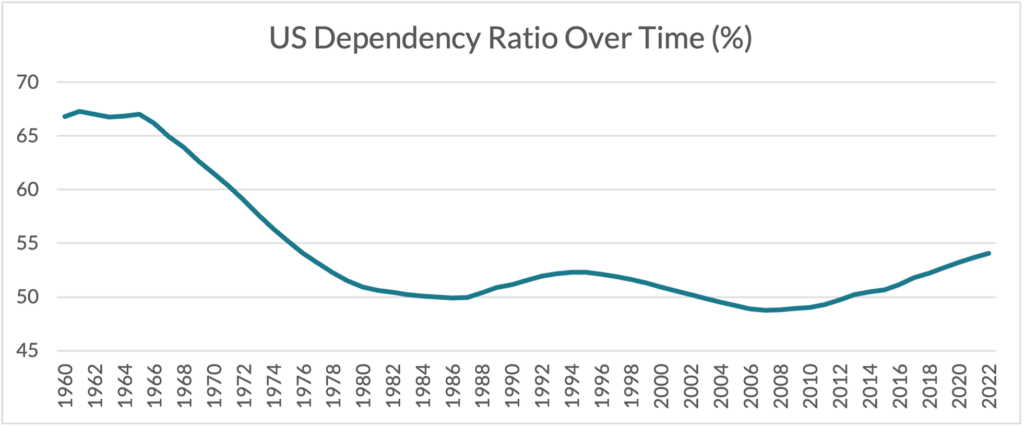
Chart 4. Source: Bloomberg
While productivity growth will help abate the inflationary effects of wage pressures, thereby helping in asset price returns, aging demographics in the US is a factor that we at Trajan Wealth build into our analysis when evaluating asset allocation and the long-term potential of client portfolios. As illustrated by the chart above, the US “Dependency Ratio,” which simply means the ratio of non-working “dependents” to active workers, is increasing as the baby boomer generation starts to retire. Subsequent cohorts displayed smaller families, and the immigration faucet has been restrictive since the terrorist attacks of September 11th, 2001. The result – a larger ratio of non-workers to active workers, which translates into funding challenges for programs such as Medicare and Social Security and increasing burdens on the Federal budget. To keep the Medicare and Social Security trust funds solvent, the US government will have to either (1) raise taxes, (2) cut benefits, or (3) expand borrowing; the first two options are not positive for growth, while the third puts upward pressure on interest rates. We highlighted the growing level of US indebtedness in earlier monthly newsletters, suffice to say the federal deficits continue year after year at elevated levels to overall US GDP.
Implications
While we believe that inflation will eventually stabilize (perhaps at higher than the Fed’s 2% target), our assumptions for asset class returns going forward are considerably lower than what clients experienced during the “cheap money” period between the summer of 2009 through the first quarter of 2022. We expect rates on intermediate and longer maturities to remain range bound near current levels (4.5% on the US Ten Year Treasury, 4.6% on the US Thirty Year Treasury) through much of the upcoming cycle, very much in line with long-term averages if we strip the inflationary shocks of 1970’s and early 80s. Thus, compared to the past 10-12 years, we see less tailwind from cheap borrowing costs. Similarly, the prospect of higher taxes and/or rate shocks to the upside because of accelerating Federal debt paints a more sobering picture for most risk assets going forward.
Recommendations
We continue to advocate an elevated level of diversification across asset classes and develop specific asset allocation perimeters that cater to individual risk-tolerance thresholds. At the risk of sounding self-serving, we also believe that given our outlook for more moderate returns going forward, and the prospect of higher taxes, it may be prudent for clients to save and invest a greater proportion of their disposable income. Per eminent financial planner Dave Ramsey, “Financial peace isn’t the acquisition of stuff. It’s learning to live on less than you make, so you can give money back and have money to invest. You can’t win until you do this.”
Portfolio Enhancement Possibilities with Private Markets
For clients who are eligible, we would recommend calculated allocations to private assets – private equity, private commercial real estate, infrastructure, and private credit to capture illiquidity premiums and potential manager “alpha” that comes from skill, access, and club-deal networks. The chart below illustrates the portfolio enhancement opportunities – Higher reward (returns) for any given level of risk, or alternately, lower risk for any level of return; that may be possible by carefully adding less-illiquid, private assets – called Alternative Investments, to a traditional asset allocation comprised of various weightings of public stocks and bonds. For clients/prospects interested in exploring these opportunities, please call our Portfolio Management Group at (800) 799-3320.
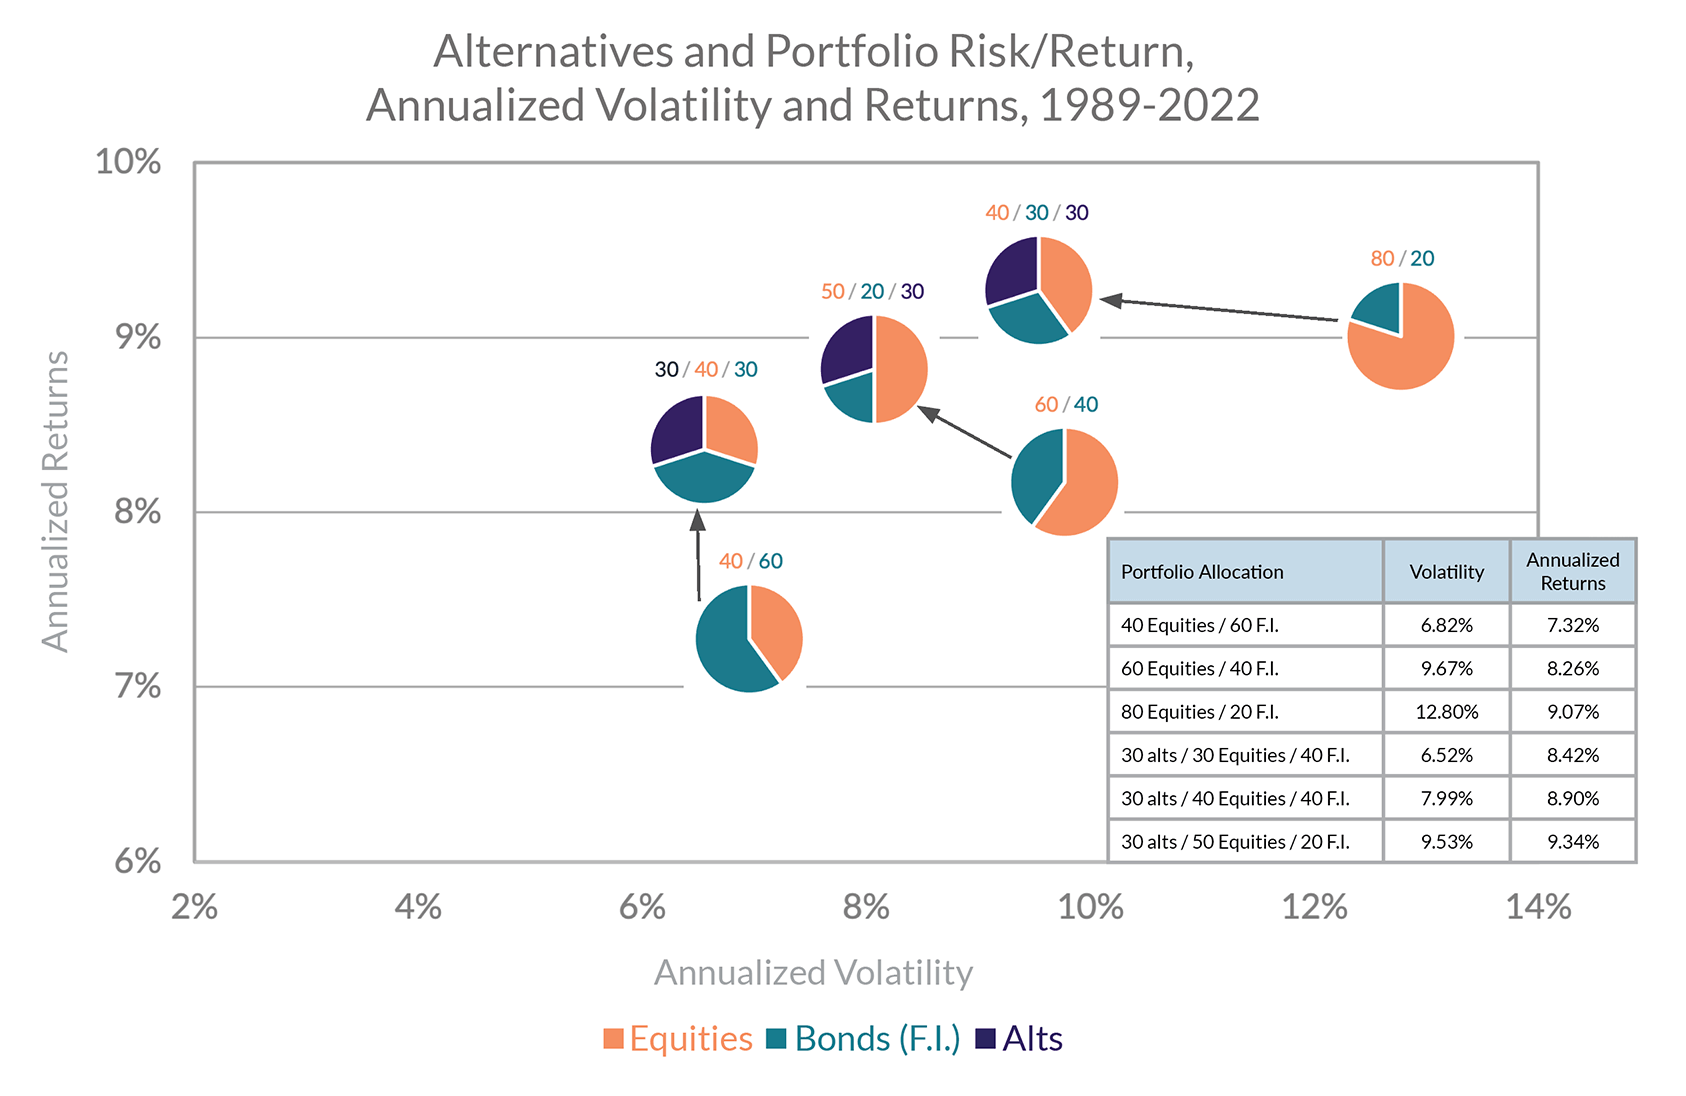
Chart 5. Bloomberg, Burgiss, HFRI, NCREIF, Standard & Poors, Factset, JP Morgan Asset Management. Allocations to alternatives benefit both the return and risk profile in investors’ portfolios across multiple decades.
*All figures are hypothetical and do not reflect fees. Past performance is not an indicator of future performance. Your results may vary. Private Equity investments: May require accreditation.
