“Interest rates are to asset prices what gravity is to the apple. When there are low interest rates, there is a very low gravitational pull on asset prices.”
~ Warren Buffett
Market Returns & Outlook
The markets rebounded sharply in November, with stocks and bonds posting extraordinarily high returns for the month (see table below). Year-to-date returns across major equity indexes now range from about 6.02% in the US Small/Mid Cap sector to an impressive 37.01% in the tech heavy NASDAQ. In the broader S&P 500, YTD returns are now about 20.8%. The driver for the uplift in financial assets was a strong rally in the bond market – the Bloomberg Aggregate posted a monthly return of 4.53% in November, the highest in over two decades. As our readers would suspect, a drop in intermediate/long term bond yields served as “rocket fuel” for the markets, driving discount rates lower and prices sharply higher.
| Index | YTD TR (%) | November 2023 |
|---|---|---|
| US Large Cap – S&P 500 | 20.79% | 9.13% |
| US Large Cap – Tech Heavy NASDAQ | 37.01% | 10.84% |
| International Equity – MSACWI ex US | 10.66% | 9.02% |
| US Small/Mid Cap – Russell 2500 | 6.02% | 8.99% |
| Bloomberg Aggregate Intermediate Bond Index | 1.64% | 4.53% |
Chart 1
US Inflation
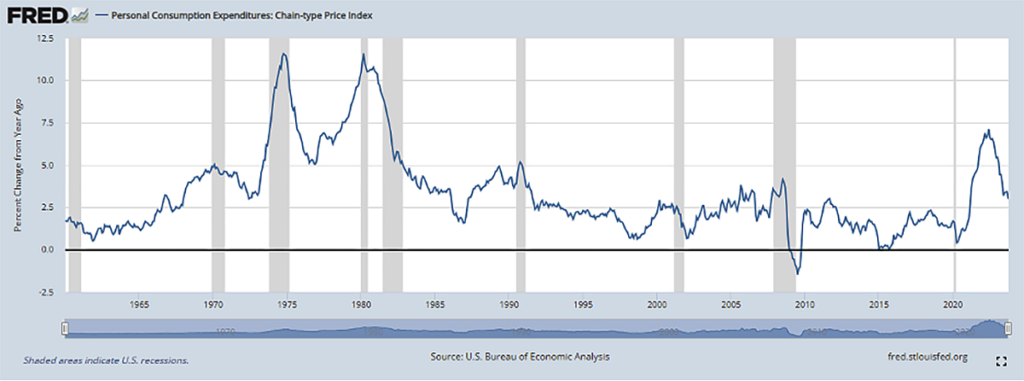
Chart 2. Source: US Bureau of Economic Analysis
The trigger for lower bond yields was good news on the inflation front. The Federal Reserve Bank’s preferred gauge of inflation – the Personal Consumption Expenditure Deflator (“PCE Deflator”) fell sharply in the third quarter of 2023; the most recent reading coming in at 3.0%, a level trending towards the Fed’s 2% target. Unsurprisingly, intermediate, and long-term bond yields fell sharply with the release of lower inflation data, enabling all risk assets to post strong rallies during the month.
Besides the good news on inflation, the overall US economy is being propelled by (1) a stout consumer, whose spending has shifted over the course of the year from “experiences” towards goods; (2) continued business spending on software, data, analytics, and other digital services – especially Artificial Intelligence, and (3) an ongoing boom in manufacturing facilities investment, which currently stands at 2.3x 2019 levels.
US Treasury Yields – Changes in November
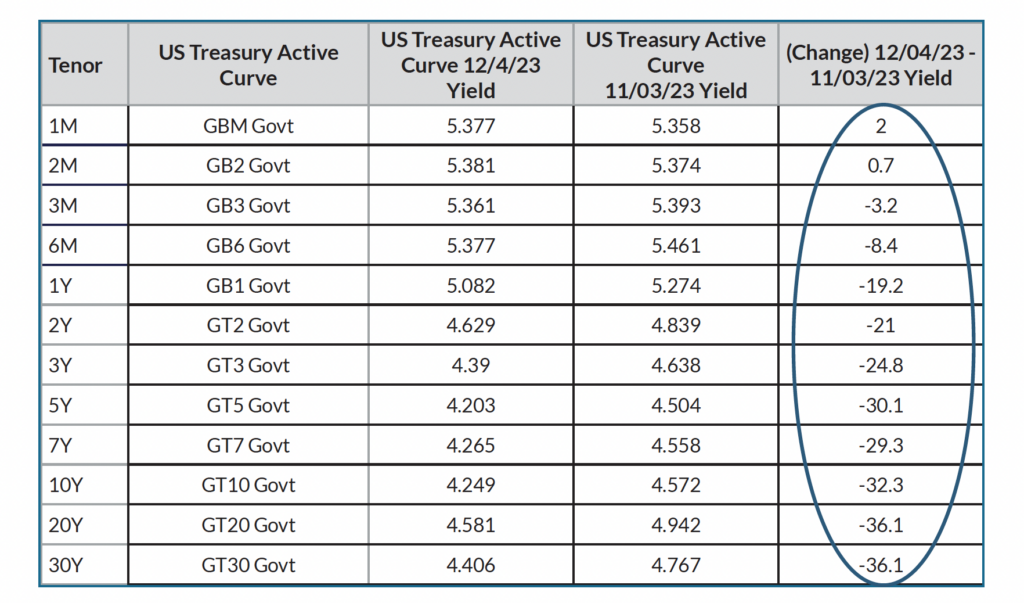
Chart 3. Source: Bloomberg
Besides the good news on inflation, the overall US economy is being propelled by (1) a stout consumer, whose spending has shifted over the course of the year from “experiences” towards goods; (2) continued business spending on software, data, analytics, and other digital services – especially Artificial Intelligence, and (3) an ongoing boom in manufacturing facilities investment, which currently stands at 2.3x 2019 levels.
Against the good news from inflation, investment and spending, there is the increasing risk of high indebtedness that keeps us cautious in our views of economic growth and asset price performance as we look forward to 2024 and the next cycle. Remember, increasing indebtedness acts as a headwind to spending, business investment and growth since higher levels of revenues and income are consumed by debt service obligations.
US Debt & Federal Budget Deficits
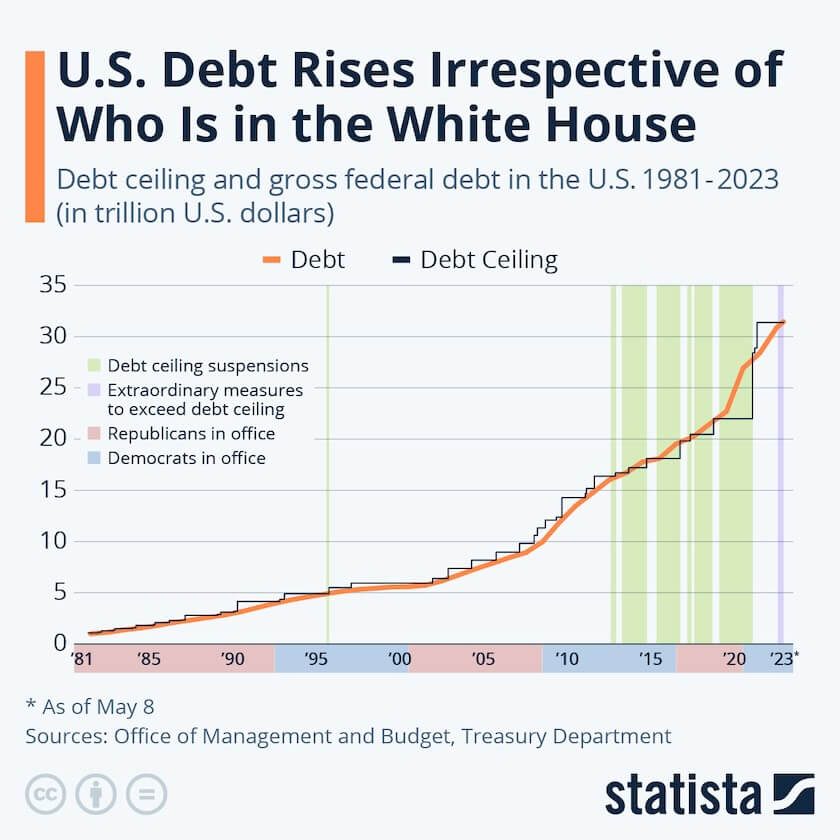
Chart 4. Sources: Statista, US Office of Management & Budget, Treasury Dept.
In light of the indebtedness, the US Federal Government’s debt levels, debt servicing requirements, and indeed the Federal budget balances raise a cautionary picture for the levels of future interest rates, notwithstanding the growing view that the Fed’s tightening of interest rates is since March 2022 may finally be having its desired effect. At this juncture, it is important to note that the Fed only controls short-term interest rates by setting the level at which banks lend to each other in the overnight market. While the Fed’s overnight certainly influences rate across longer maturities, it is investors who determine rates on longer term US Treasury notes and bonds by bidding for them at what they believe are “fair” levels during US Treasury auctions. And just like any commodity, the greater the supply of US treasuries at any given auction, the cheaper the price it commands to clear the market – meaning higher yields. In addition, as the level of indebtedness increases, so does the probability of difficulties servicing the debt, leading to greater credit risk premiums.
Federal Surplus or Deficit
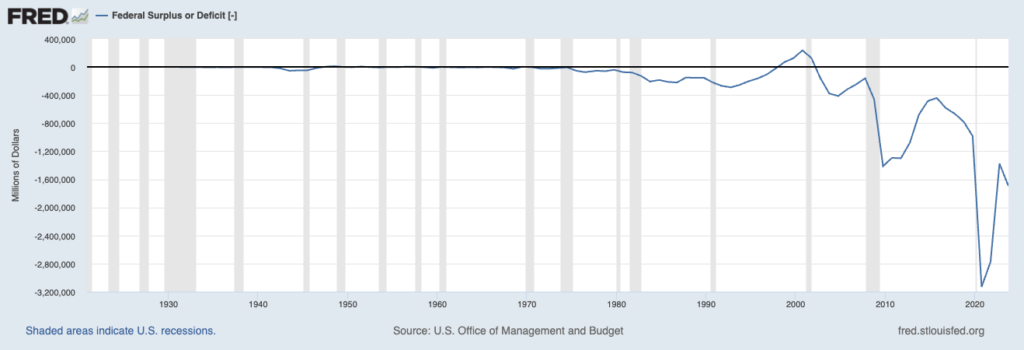
Chart 5. Sources: Federal Reserve Bank of St. Louis, US Office of Management & Budget
The growth in Federal debt is driven simply by our nation’s propensity to spend more than we receive from tax revenues (the budget deficit) – a phenomenon that started in the early 1980s (setting aside WW2) but went on overdrive as a response to the Great Financial Crisis of 2008/2009. Disconcertingly, our country has been running $1 trillion+ federal deficits consistently since the onset of the COVID-19 pandemic, necessitating the continued issuance of Federal debt to cover the budgetary gap between tax receipts and government spending. The growing issuance of US Treasury debt is putting upward pressure on Treasury yields across intermediate and longer-term maturities, irrespective of whether the Federal Reserve pauses on increases to short term overnight policy rates.
Implications
Higher interest relative to the decade following the end of the Great Financial Crisis is now a global phenomenon. Growing indebtedness will lead to investors demanding higher yields as governments and corporations keep meeting “funding gaps” through debt issuance. We feel higher debt servicing costs will impact business earnings in the aggregate. As such, allocations to residual income streams – that is, equity, should largely be weighted to less indebted issuers with a proven ability to sustainably grow revenues. Debt investments should similarly be weighted towards “quality issuers” who have adequate debt interest coverage to not only service their current debt obligations (make good on interest payments) but also be able to refinance their existing debt at potentially higher interest rates when the debt contracts mature.
Recommendations
We continue to advocate an elevated level of diversification across asset classes and develop specific asset allocation parameters that cater to individual risk-tolerance thresholds. In the context of higher yields and the prospect of slower economic growth, Fixed Income assets should command a higher weighting in most portfolios; we would highly recommend our clients to reach out for a portfolio review if one has not been done over the course of the last 24-36 months. We also believe that non-traditional asset classes – “real assets” such as real estate and infrastructure, as well as private equity and private credit merit consideration given the real portfolio enhancement opportunities as we transition to a potentially lower growth and earnings environment. For investors with a long-term investment horizon, the illiquidity premium in private assets is an attractive source of additional returns.
Need to Review Your Investments?
*Investment in private equity may require accreditation.*
