“Despite some severe interruptions, our country’s economic progress has been breathtaking. Our unwavering conclusion: Never bet against America.”
~ Warren Buffett
Growing Wealth In The US Financial Markets
Following the turmoil in September, October turned out to be an excellent month for the US equity markets. The S&P 500 rebounded 8.09%, while the Dow Jones posted its highest monthly return of 14.06% since 1978. The bond market –Barclays Capital Intermediate Index fell (1.30)%, driven by slightly higher yields on the benchmark 5-year US Treasury note and rising credit spreads across the US Corporate and Mortgage-Backed Securities sectors. The FOMC, for its part, raised overnight rates by 0.75% at the November 2nd FOMC meeting, exacerbating volatility in early November. This, along with the almost mirror-like rebound in US equities from the September lows in October, illustrate the difficulties in successfully “timing the market” based on daily releases of economic data or Analyst musings of future corporate earnings.
At the risk of sounding like a broken record, we continue to advise investors to consider their long-term financial objectives and realistic risk tolerance thresholds when determining their asset allocation. The overriding urge to react to current market volatility or predict future volatility is most likely to be self-defeating. Instead, it is best to remain invested in sound economic engines and proven business models under the time-tested paradigm that risk assets, as a group, eventually earn their risk premiums. In this context, US equities, despite periodic levels of elevated price volatility, deliver returns commensurate with the profitability and growth prospects of the underlying industry sectors.
In this context, looking at long-term US equity performance and decomposing performance by sectors is useful. Since it is difficult to obtain granular, sector level data that is comparable (for example, adjusted for biases such as size, survivorship, and changes in control, among others), we simply want to illustrate the point using broad indexes, their relative sector weightings, and their relative share in total US equity market capitalization.
US Equities – Tech Sector vs. Broad Marketi

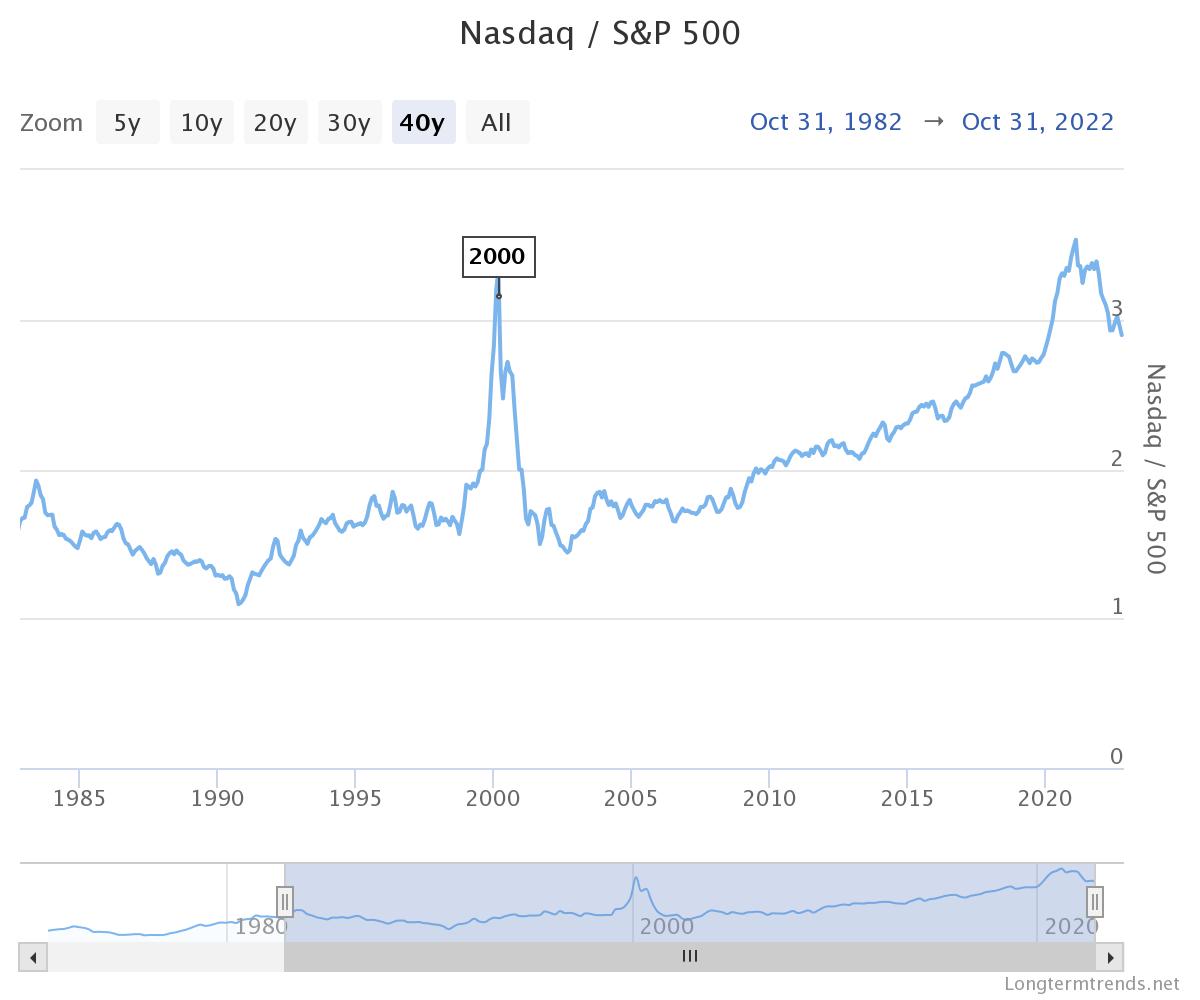
Fig 1: Longtermtrends.net
Chart 1 shows the equity capitalization ratio between NASDAQ Composite and the S&P 500. The S&P 500 is an index of the largest five hundred stocks by market capitalization and represents about 80% of the overall equity market capitalization of listed US companies. The NASDAQ Composite is a larger universe of 3,740 companies and is aggregated by market capitalization, similar to the S&P 500. Thus, the ratio (NASDAQ/S&P 500) of market capitalization being greater than 1 is hardly surprising. The revealing statistic in Chart 1 is the overall trend line. Starting from a ratio of approximately 1x in 1972, the market capitalization of the NASDAQ reached over 3.4x the S&P 500 by the end of 2021 and is currently at 3.0x post the bear market sell-off YTD in 2022. Why is this important? The NASDAQ has traditionally been a technology-heavy (broadly defined) index. Even today, Information Technology (defined by the “Computer Index”) and Telecommunications account for over 52% of overall market capitalization. The comparable technology weighting in the S&P 500 is a much lower 32%.
To reiterate, the ratio in the chart divides the NASDAQ Composite Index by the S&P 500. When it rises, the NASDAQ outperforms the S&P 500. When it falls, the NASDAQ underperforms. The upward-sloping ratio trendline illustrates that the NASDAQ has outperformed the S&P 500 since the 1970s, suggesting that a heavier weighting to technology has been accretive for long-term investors.
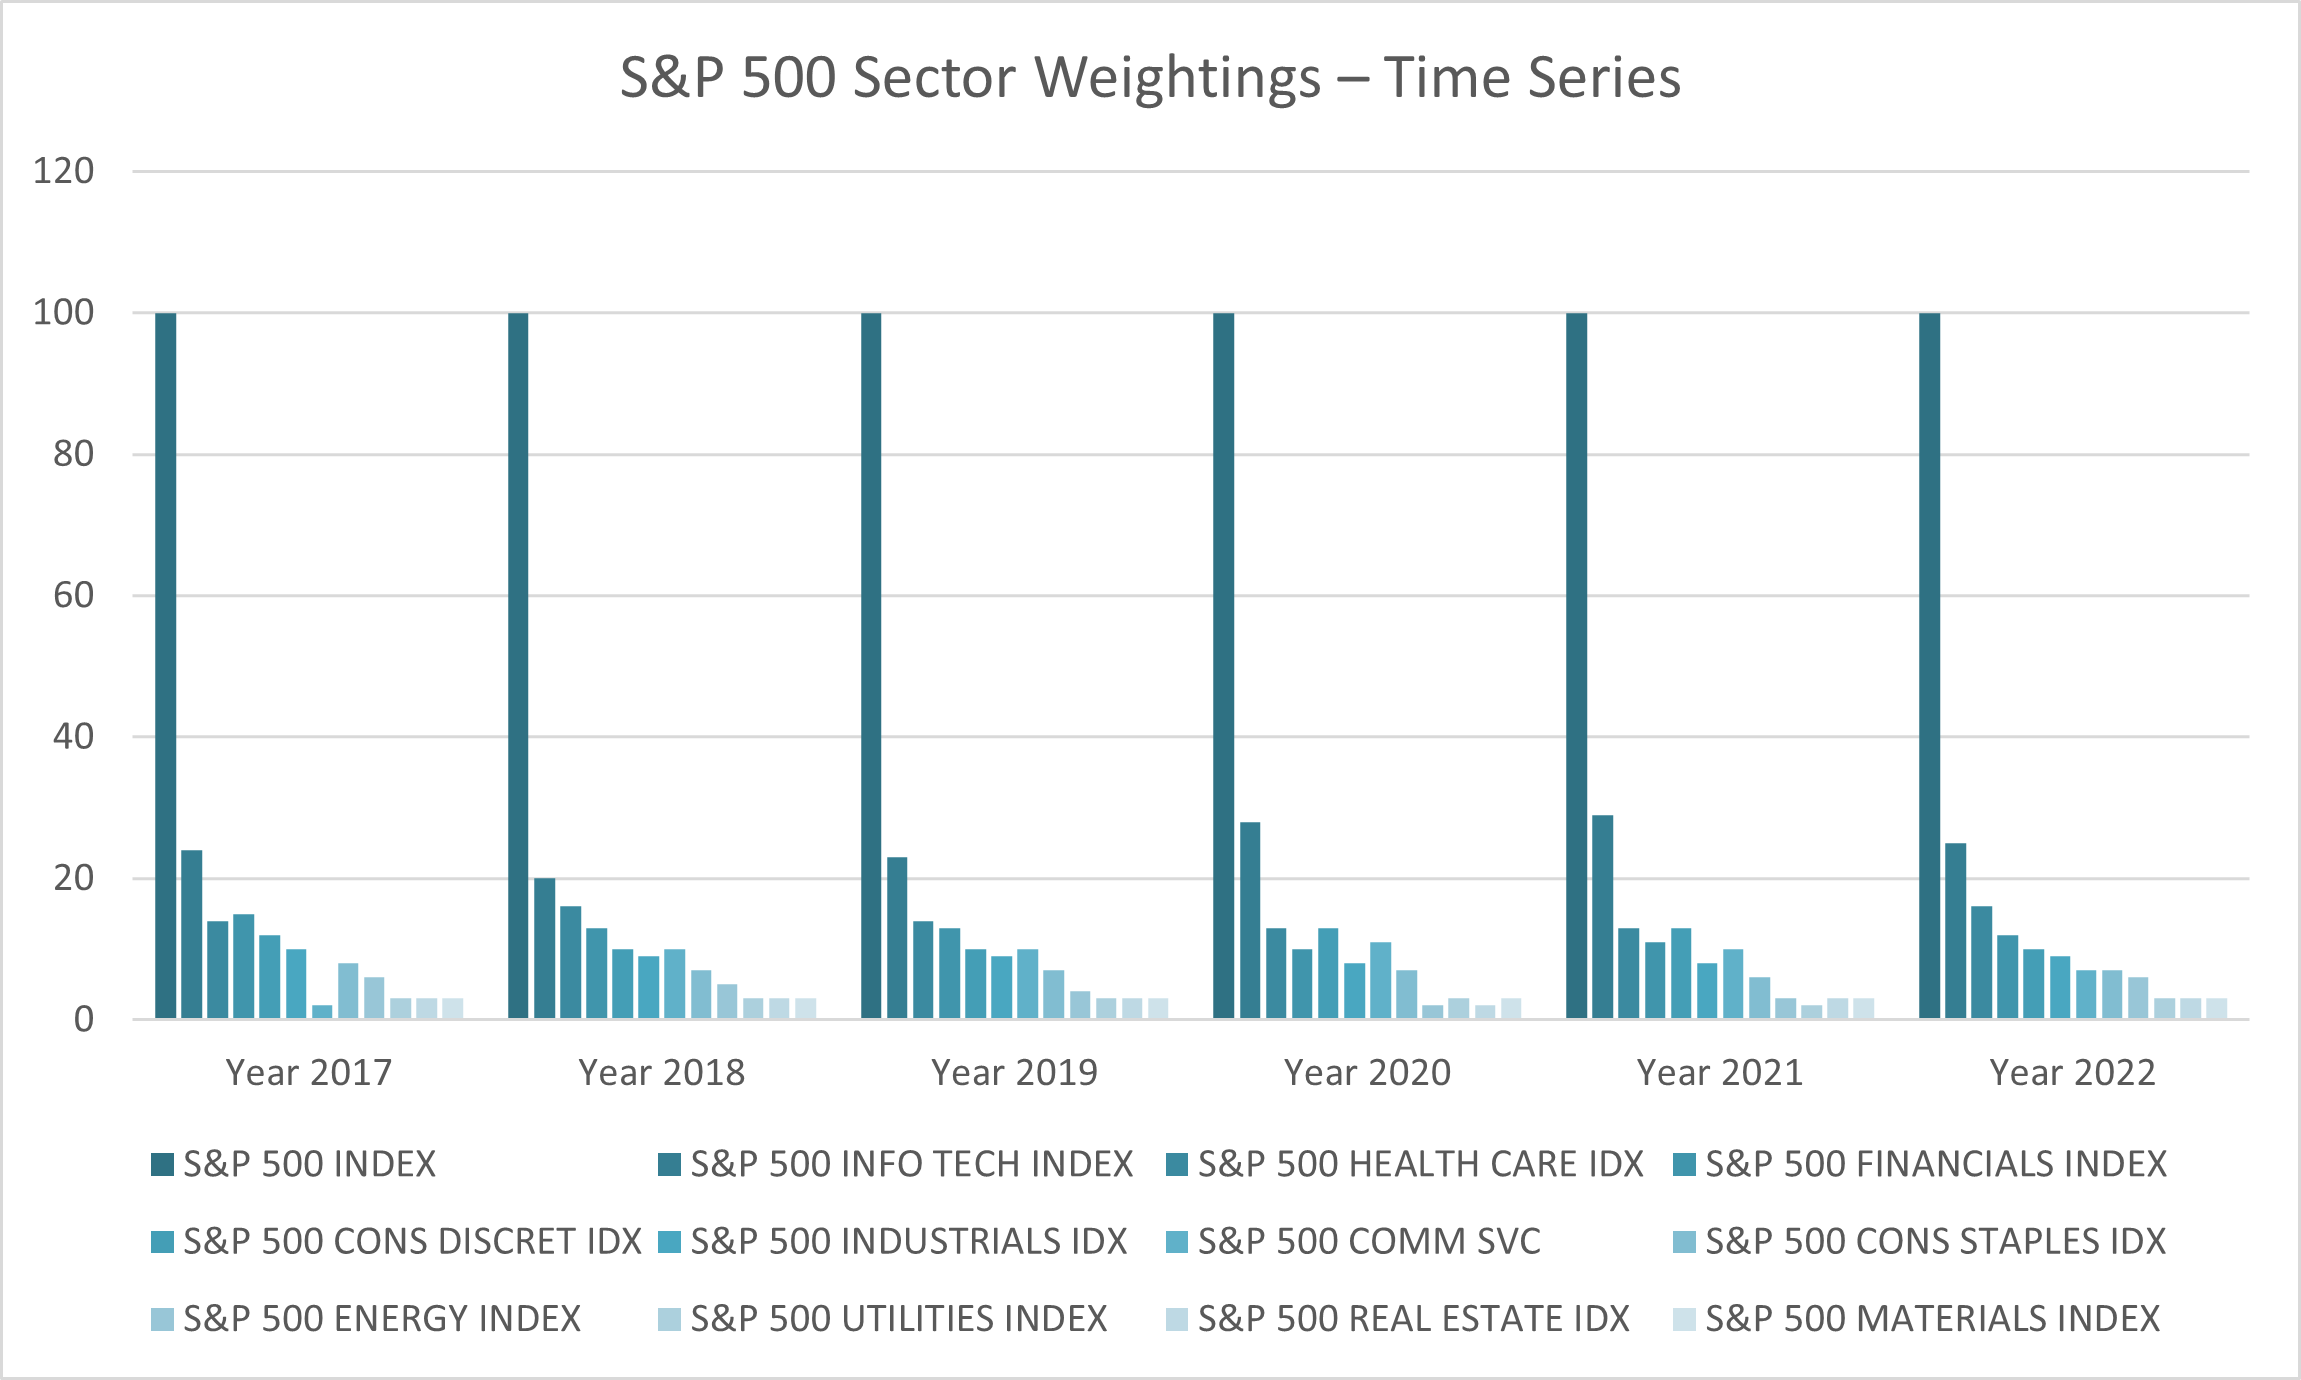
Interpretation: The technology sector, predicated on growth and back-ended earnings and cash flows, is inherently riskier than less “innovation-dependent” businesses such as the Consumer Staples, Mining, Banking, Insurance, Retail, Energy, and Industrial sectors. However, if held for the long term, history suggests that a diversified portfolio of high-technology stocks will outperform the overall market by eventually earning their higher risk premiums. In addition, the growing weight of the technology sector within the S&P 500 – see chart 2, illustrates the increasing role of technology in overall US wealth creation, particularly since the onset of rapid globalization in the 1990’s. We hypothesize that the US economy has a sharp and increasing comparative advantage in the high-tech sector vs. the rest of the world. By contrast, the US economy is suffering from a growing comparative disadvantage in more labor-intensive and extractive sectors such as manufacturing, industrials, mining, and basic materials. This is consistent with real and persisting wage differentials between the US (and, to some extent, Western Europe) and most of Asia, Latin America, Africa, and Eastern Europe – collectively grouped as the Emerging Markets. We will discuss the implications for asset allocation in our conclusions.

Fig 2: Bloomberg – S&P 500 Sector Weightings – Time Series

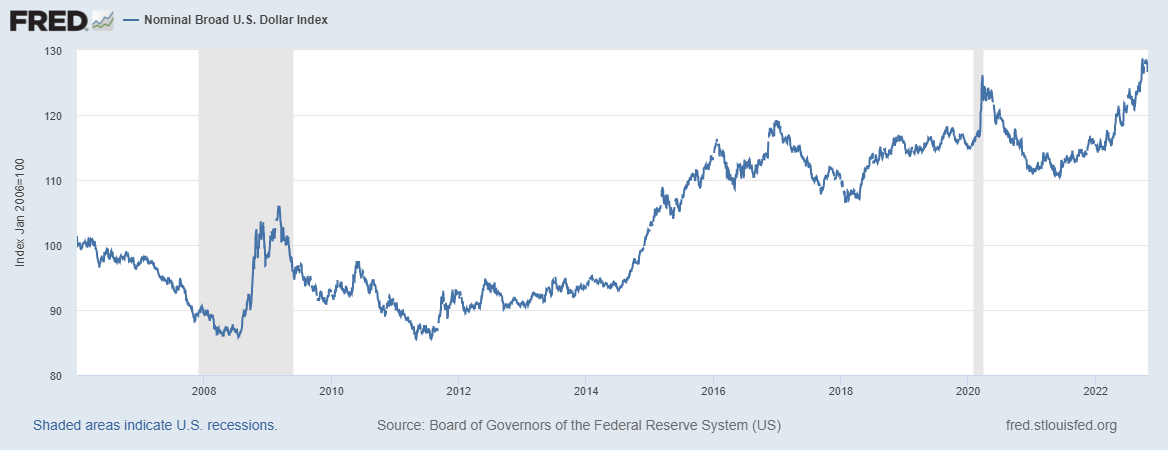
Fig. 3: Board of Governors of the Federal Reserve System
An intuitive response to the shifting levels of competitiveness across equity sectors by country/region would perhaps entail overweighting the US technology sector in an overall asset allocation while relying on international and emerging markets for non-technology-related exposure. However, this type of allocation may introduce unwarranted levels of currency risk from the perspective of a US-based investor, whose liabilities that the investment portfolio is purported to fund are primarily denominated in US Dollars. For much of post-war history, the US Dollar, being the legal tender of the world’s largest, highly diversified, and most business-friendly economy, has been seen as the “safe haven” during times of economic and geopolitical turmoil. This phenomenon has held even when the US economy experienced sharp downturns in GDP growth. The above chart illustrates the upward trend in the value of the US Dollar vs. its major trading partners over the last two decades – note the sharp upticks during the 2008/0 9 Financial Crisis, the onset of Covid-19, and the current global slowdown and bear markets.
Thus, it is eminently possible that a portfolio weighted heavily towards International and Emerging Market stocks for non-technology-related exposure might experience sharply negative currency returns in the international component, obviating the sector-specific comparative advantage and diversification benefits that investing internationally might otherwise offer. This is highly probable in the event of a severe global recession going into 2023.
Global indebtedness – relatively speakingiv

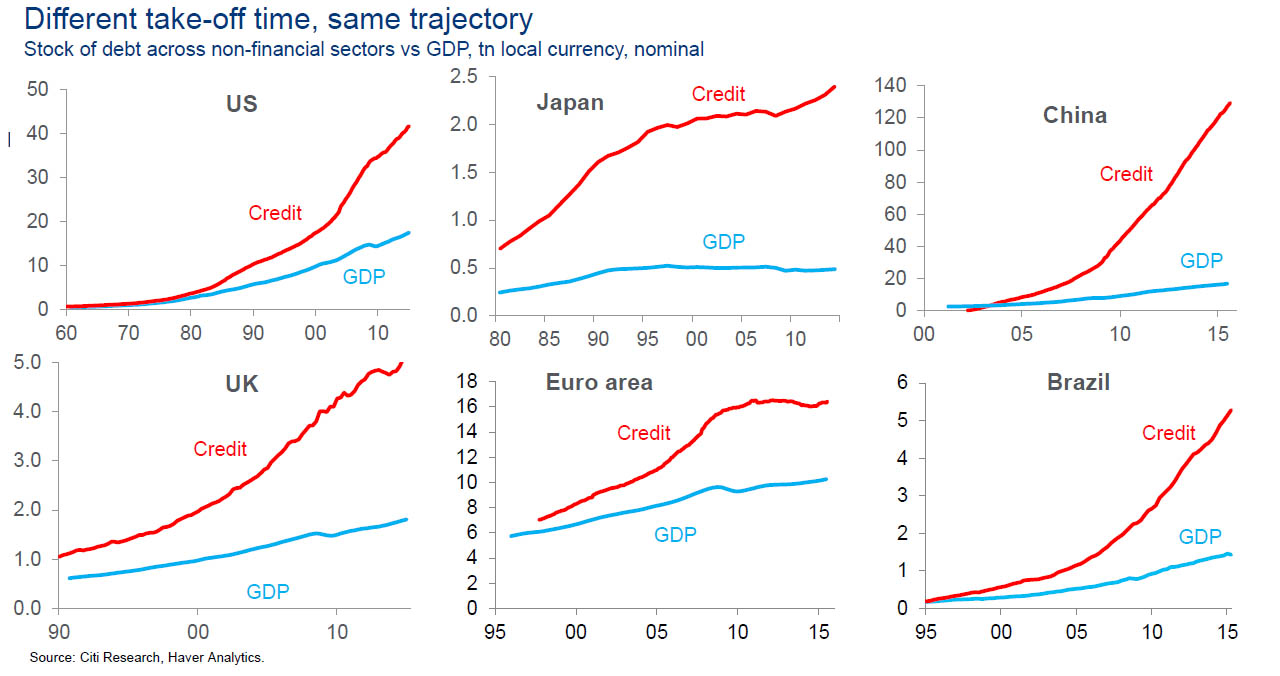
Fig 4: Citi Research, Haver Analytics
Heading into the US mid-term elections, it is understandable to expect increased political and market commentary on the size of our national debt and its implications for inflation, interest rates, growth, and prosperity going forward. Inflation, interest rates, and growth will undoubtedly affect financial market returns. However, before capitulating to talk of impending gloom and doom, it is important to note that investment decisions and financial flows are predicated on the relative growth and inflation prospects of all alternatives within the investible universe. As depicted in chart 4 above, the US does indeed have a growing Debt/ GDP problem. With about $40 trillion in non-financial sector debt outstanding in 2015, the Debt to GDP ratio crossed 200%. However, this is low/at par against large competitors – in line with Western Europe and Brazil and significantly lower vs. UK and China. Thus, if any impending slowdown raises questions regarding solvency and debt servicing capabilities, it seems reasonable to believe that the US markets will experience large capital inflows from international investors, lowering the cost of capital for US businesses, and thereby stimulating a speedier and more sustained recovery.
Implications
It is beyond doubt that markets are experiencing challenging headwinds as 2022 draws to a close and we usher in the new year. Inflation in the United States is running at a 40-year high, and the FOMC has set the curtailment of inflationary pressures as the primary objective of monetary policy for the near future. The fixed-income markets have priced in a Fed Funds rate of 5% by April 2023; the prospect of any further rises could further impact the valuations of all risk assets. However, a 5% Fed Funds rate is not excessively high by historical standards, and the cumulative effect of tightening monetary policy since November 2021 will most certainly truncate inflationary pressures going forward. There is strong economic evidence to suggest that monetary policy is an effective tool to combat inflation; however, the restraining effects works with a lag. As such, we believe that it is important for investors to remain invested and ignore the short-term volatility that changing perceptions of Fed policy over the next six to twelve months might drive. For long-term investors focused on growing capital, healthy exposure to the high-margin, high-growth, innovation-oriented US technology sector seems to be a time-tested way of enhancing purchasing power and funding future liabilities. As time horizons get compressed, and a measure of principal stability becomes imperative, we suggest investors layer in dividend-paying stocks and, increasingly, fixed-income assets. A diversified portfolio of US Fixed Income assets – proxied by the Barclays Capital Aggregate Index is yielding close to 5.5% with a duration (present value weighted average time to maturity) of about 5 years. Thus, with an estimated annualized risk of about 5%, US bonds yielding a 5.5% generate a reward risk ratio in excess of 100%.
Recommendations
As investment practitioners, we continue to advocate an elevated level of diversification across asset classes following individual risk-tolerance thresholds. However, we believe that non-traditional asset classes – “real assets” such as real estate merit consideration in light of persisting inflationary pressures. We also expect elevated levels of market volatility going forward, if only due to rapidly rising financing costs. As such, absolute return strategies – trend following, equity/credit market dispersion, which benefit from volatility may be appropriate for certain investors in an overall asset allocation. We continuously look for these unique sources of returns for our clients and will make recommendations as we develop additional strategies and update our asset allocation models.
In summary, with higher financing costs, lower projected growth, and an uncertain geopolitical environment, we would advocate a distinctive “quality bias” in overall portfolio management, overweighting issuers with low debt and discernible pricing power. Furthermore, history has proven the efficacy and regeneration capacity of the US economy and US financial markets in periods of economic and market distress – the self-correcting mechanisms of capitalism and free enterprise have decisively delivered better outcomes than its alternatives. As such, we are maintaining a measure of “home country bias” in our portfolio construction strategies. In the immortal words of Warren Buffett, “Despite some severe interruptions, our country’s economic progress has been breathtaking. Our unwavering conclusion: Never bet against America.”
UDAYAN MITRA, CFA
~ Trajan Wealth Chief Investment Officer


