“The FOMC has considerable control over short-term interest rates. We have much less influence over longer term rates, which are set in the marketplace.”
~ Jerome Powell. Chairman, Federal Reserve Bank
Market Returns & Outlook
The markets continued trending lower in October, with stocks and bonds once again posting negative returns for the month (see table below). Year-to-date returns across major equity indexes now range from about (2.72)% in the US Small/Mid Cap sector to a still impressive ~23.61% in the tech heavy NASDAQ, the latter still substantially outperforming its historical annual average (note, we are 10 months into 2023) spanning multiple decades. In the broader S&P 500, YTD returns of about 10.68% is in line with long-term annual averages for large cap equity returns in the United States. A lot of the tapering in risk asset performance is driven by a sharp increase in bond yields – 10-year US Treasury yields started the month at 4.57% and ended at 4.93%. The increase of about 36 basis points or 0.36% equates to a decline of about 3% in terms of the Treasury note’s market price.
| Index | YTD TR (%) | October 2023 |
|---|---|---|
| US Large Cap – S&P 500 | 10.68% | (2.10)% |
| US Large Cap – Tech Heavy NASDAQ | 23.61% | (2.76)% |
| International Equity – MSACWI ex US | 1.49% | (4.11)% |
| US Small/Mid Cap – Russell 2500 | (2.72)% | (6.07)% |
| Bloomberg Aggregate Intermediate Bond Index | (2.76)% | (1.58)% |
Our outlook for future equity and bond returns over the next cycle merits a certain level of caution. As our investors will recall, the market value of an asset is based on the present value of the discounted net cash inflows the asset is expected to generate in the future. “Discounting” future cash inflows is required to recognize that a Dollar earned today is more valuable than a Dollar earned a few years from now, since today’s Dollars can be invested to earn interest. Thus, future Dollars earned have to be discounted by the prevailing rate of interest to determine its present value. If interest rates rise, other things being equal, the present value of the asset falls. The question therefore is, what causes interest rates to rise, and will those factors be at play over the next 7–10-year cycle?
US Debt & Federal Budget Deficits
An intuitively obvious factor that affects the levels of interest rates is the level of indebtedness. As individuals or issuers look increasingly to fund consumption/ investments through borrowed capital, the demand for credit extends. The supply of credit is determined by the level of savings – which tends to be “sticky” over short/ intermediate periods. Thus, with supply constrained and demand up, the price of loanable funds (interest rates) tend to go up. This is also exacerbated by “credit risk” – the higher an entity’s indebtedness relative to its income, the higher the risk premium investors require for the elevated possibility of borrower default.
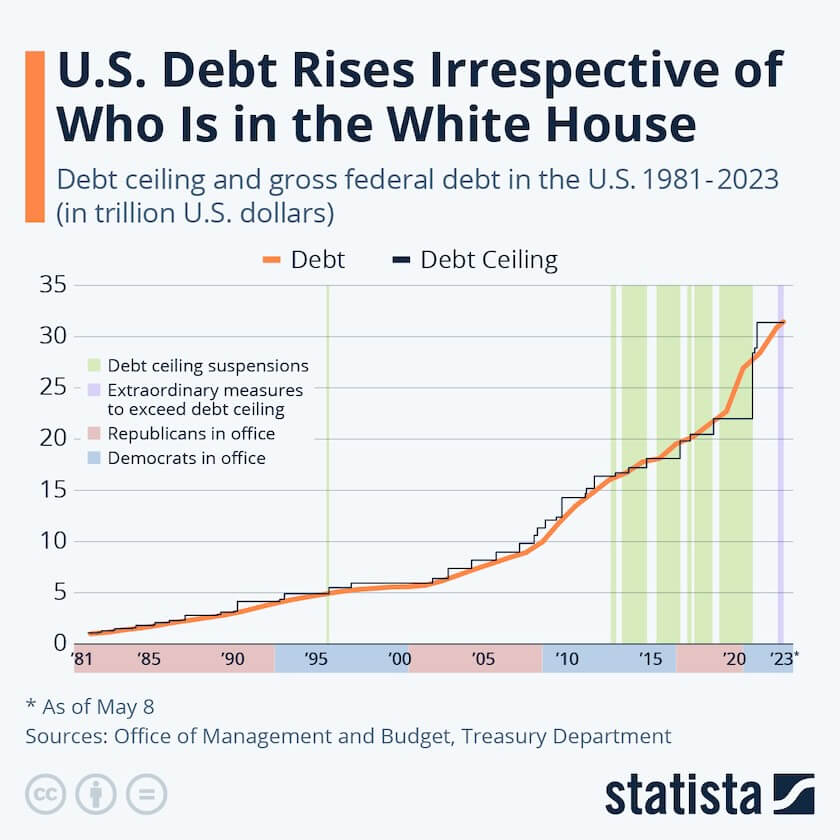
Chart 1. Source: Statista, US Office of Management & Budget, Treasury Dept.
In light of the indebtedness, the US Federal Government’s debt levels, debt servicing requirements, and indeed the Federal budget balances raise a cautionary picture for the levels of future interest rates. Notwithstanding the recent furor over the debt ceiling in Washington, history has shown that the level of US debt rises, irrespective of which party controls the White House (or indeed the Congressional chambers) in our nation’s capital – see Chart 1 above.
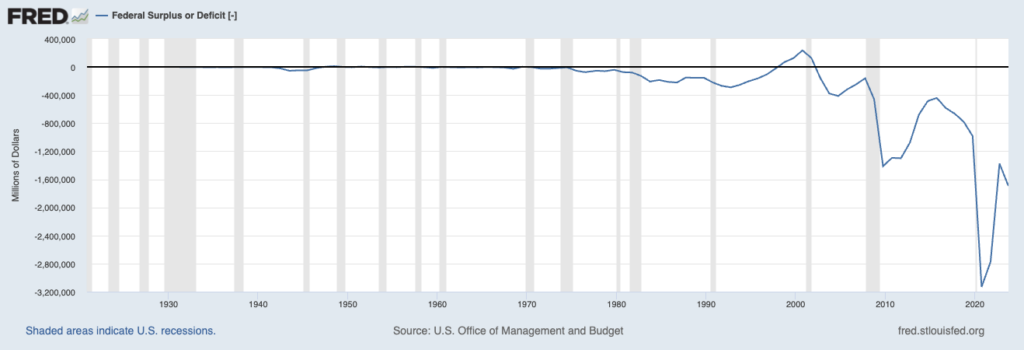
Chart 2. Sources: Federal Reserve Bank of St. Louis, US Office of Management & Budget
The growth in Federal debt is driven simply by our nation’s propensity to spend more than we receive from tax revenues (the budget deficit) – a phenomenon that started in the early 1980s (setting aside WW2) but went on overdrive as a response to the Great Financial Crisis of 2008/2009. Disconcertingly, our country has been running $1 trillion+ federal deficits consistently since the onset of the COVID-19 pandemic, necessitating the continued issuance of Federal debt to cover the budgetary gap between tax receipts and government spending. The growing issuance of US Treasury debt is putting upward pressure on Treasury yields across intermediate and longer-term maturities, irrespective of whether the Federal Reserve pauses on increases to short term overnight policy rates. As quoted by Fed Chairman Jerome Powell – “The FOMC has considerable control over short-term interest rates. We have much less influence over longer term rates, which are set in the marketplace.“
Inflation and FOMC Policy
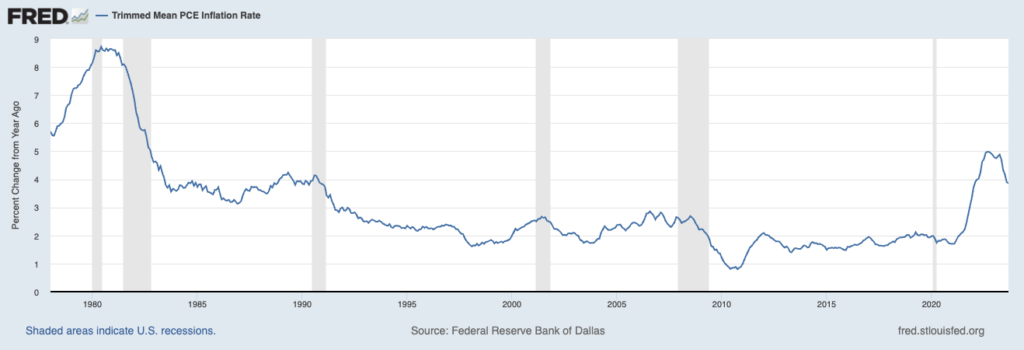
Chart 3. Source:Federal Reserve Bank of Dallas
While the FOMC has less influence over longer term rates, the overnight policy rate at which banks lend to each other and constitute the basis of money market or short-term yields, is directly driven by the Federal Reserve’s bank’s Open Market Committee (“FOMC”). It is important to note that the FOMC has two, some would say conflicting, mandates. The first is price stability – which means low, and stable rates of inflation. The second mandate is to create the conditions for sustained economic growth, for which low borrowing costs are usually a favorable factor. For price stability, the Fed has an explicit inflation target – which is 2%. As depicted by chart 3 above, inflation measured by the FOMC’s favored metric, the Personal Consumption Expenditure deflator (“PCE” deflator) is currently running at about 4%, a level almost twice the FOMC’s policy target. While one of the key drivers of inflation – wage increases have shown signs of moderating in recent months, US unemployment remains near historic lows. In addition, while supply chains have largely been restored, elevated geopolitical tensions suggest that the era of unrestrained globalization (in the search for cheap labor) may be ending. Accordingly, we do not expect the FOMC to reduce the overnight rate anytime soon, unless we see a massive shock to the financial system due to cascading bank failures or geopolitical shock caused by large-scale wars or acts of terrorism.
Implications
Higher interest relative to the decade following the end of the Great Financial Crisis is now a global phenomenon. Growing indebtedness and the persistence of inflation is forcing policymakers to increase short term policy rates, and investors are demanding higher yields as governments and corporations keep meeting “funding gaps” through debt issuance. We feel higher debt servicing costs will impact business earnings in the aggregate. As such, allocations to residual income streams – that is, equity, should largely be weighted to less indebted issuers with a proven ability to sustainably grow revenues. Debt investments should similarly be weighted towards “quality issuers” who have adequate debt interest coverage to not only service their current debt obligations (make good on interest payments) but also be able to refinance their existing debt at potentially higher interest rates when the debt contracts mature.
Recommendations
We continue to advocate an elevated level of diversification across asset classes and develop specific asset allocation perimeters that cater to individual risk-tolerance thresholds. In the context of higher yields and the prospect of slower economic growth, Fixed Income assets should command a higher weighting in most portfolios; we would highly recommend our clients to reach out for a portfolio review if one hasn’t been done over the course of the last 24-36 months. We also believe that non-traditional asset classes – “real assets” such as real estate and infrastructure, as well as private equity and private credit merit consideration given the real portfolio enhancement opportunities as we transition to a potentially lower growth environment, coupled with persistently higher inflation. For investors with a long-term investment horizon, the illiquidity premium in private assets is an attractive source of additional returns.
*Investment in private equity may require accreditation.*
