Elections, Economy, and the Markets
At the time of writing, the results of the 2024 US General Elections are out, with the GOP capturing the White House and Senate, while the House of Representatives is yet to be decided. On the proverbial “day after,” US equities are up sharply – the S&P 500 and the NASDAQ posting between 2.5% to 3.0% gains and the Dow Jones up over 3.5%.i Meanwhile, bonds are declining – the 10-year US Treasury yield is up 10 basis points or 0.10%. Expectations of “pro-growth” policies – making the 2017 Tax Cut and Jobs Act permanent by a second Trump Administration is widely expected, as are rollbacks of many corporate regulations, particularly in the Financial Services industry. A growth agenda is usually viewed as fiscally expansionary, with knock on consequences for future budget deficits and the growing level of Federal debt. While we welcome any US Presidential election where the outcome is decisive, we would like to caution our clients against any heightened exuberance in their investment strategies and asset allocations. As a firm, Trajan Wealth has consistently advocated taking a long-term view of markets, and maintaining a disciplined approach based on investment goals and risk tolerance rather than election outcomes. We would remind our clients to stay focused amidst the euphoria rather than “time” entries and exits within and across asset classes. More on this later.
| Indexii | YTD TR (%) | Oct 2024 Monthly TR |
|---|---|---|
| US Large Cap – S&P 500 | 20.96% | -0.92% |
| US Large Cap – Tech Heavy NASDAQ | 21.24% | -0.49% |
| International Equity – MSACWI ex US | 9.15% | -4.86% |
| US Small/Mid Cap – Russell 2500 | 10.26% | -0.93% |
| Bloomberg Aggregate Intermediate Bond Index | 1.86% | -2.48% |
i. and ii. Source – Bloomberg
Heading into the US General Elections, strong GDP growth and inflation data depicting persistently higher inflation numbers relative to the Federal Reserve Bank’s 2% target caused bond yields to rise on diminishing prospects of sustained and aggressive rate cuts by the FOMC. International markets kept suffering from geopolitical tensions and the ongoing slowdown in the Chinese economy. Consequently, US Fixed Income returns fell sharply. And while the US equity markets stalled during the month, US equities as an asset class remained resilient year-to-date, despite underwhelming quarterly earnings in the most recent quarter and the challenging international environment – see table on October returns above.
Historical US Equity Returns Across Multiple Administrations
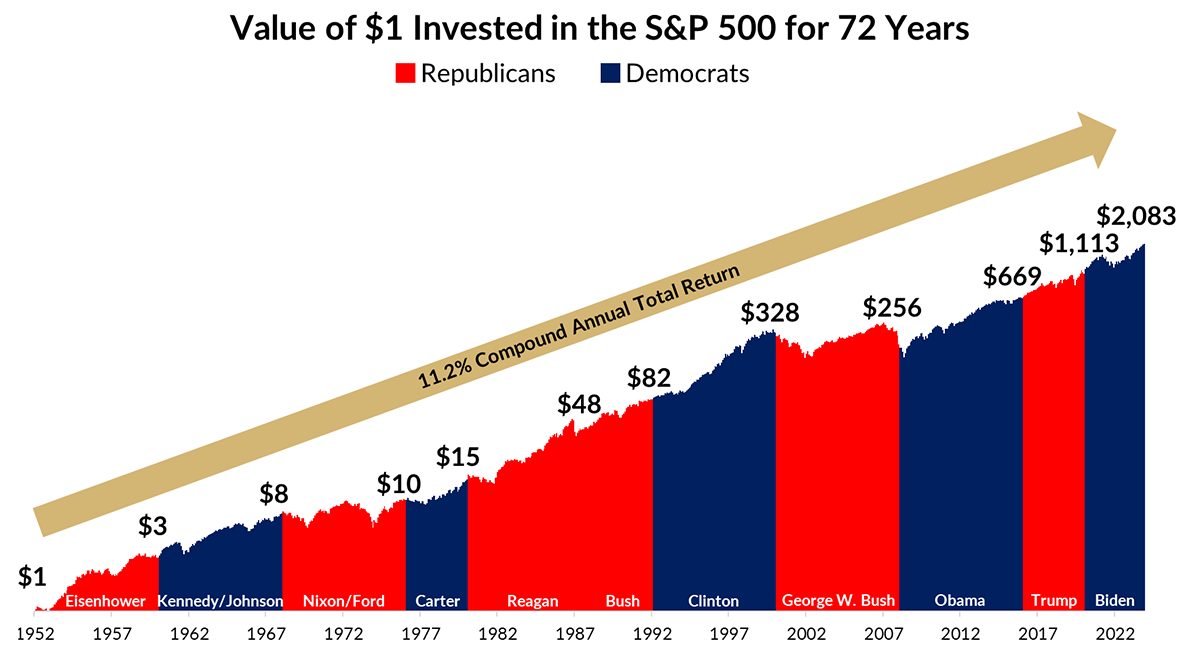
As mentioned earlier in this letter, we caution against any impulsive changes to our client’s investment portfolios based on the result of the 2024 election. US markets have proven remarkably resilient regardless of which party is in office and we have no reason to believe that returns in US equities will be sharply different from the long-term averages experienced during past administrations – see chart below. Put simply, our best guess for average annual returns on US equities over the next four years remains in the range of 11%, with average annual variations in the 18%-20% range. Our recommendation for an individual client’s asset allocation is still based on multiple factors, including remaining earned income horizons, short and long-term liquidity needs, and risk tolerance levels (defined by the maximum drawdown our clients’ can absorb without having to liquidate assets). Time and disciplined investing have proven to be the most effective ally in wealth accumulation; in the immortal words of legendary investor John Bogle, “Time is your friend; impulse is your enemy.”

iii. Monthly data from Nov. 1952 – Sept. 2024, with terms counted starting from the month of the election (inclusive). iii. Source: Bloomberg, Trajan Wealth estimates.
Pitfalls Of Impulse Investing
An Illustrative Example

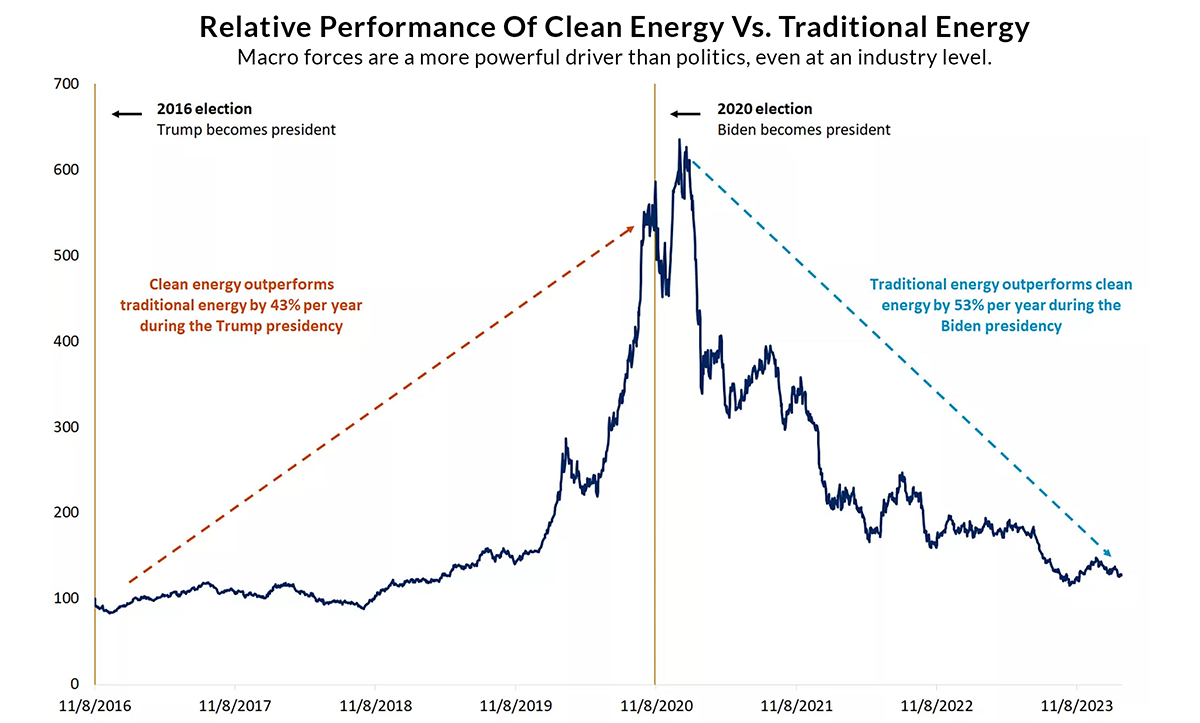
iv. Source: Morningstar Direct, Edward Jones.
We concede that most investors do not actually base investment decisions on “wild” impulses; often the impulse is backed by some type of conventional wisdom, perceived by the expressed or implied prerogatives of political ideologies. The above chart is an example of how concentrated bets on specific sectors based on politics rather than market forces can have hugely unfavorable consequences. In 2016, with the incoming Trump Administration, the conventional wisdom was that politics would be less favorable to renewable energy and highly accommodative to the expansion of fossil fuels. The follow-through implication for investing could have been centered around avoiding renewables and overweighting conventional energy. However, as solar and battery technology developed, clean energy outperformed traditional energy by 43% per year during the first Trump presidency. Similarly, an opposite argument could have been made for the Biden Administration in 2020. Eerily enough, due to a recovering economy post-COVID, demand for electricity was met by traditional fuels, culminating in a mirror opposite outperformance by traditional energy by 53% per year relative to clean energy. The point here is not to account for the merits and demerits of clean vs traditional fuels, but simply point out that market forces determine outcomes over the long term rather than political prerogatives. Thus, it is best to remain diversified to attain the best possible risk-adjusted investment outcomes.
Risks: US Debt to GDP, Fiscal Plans
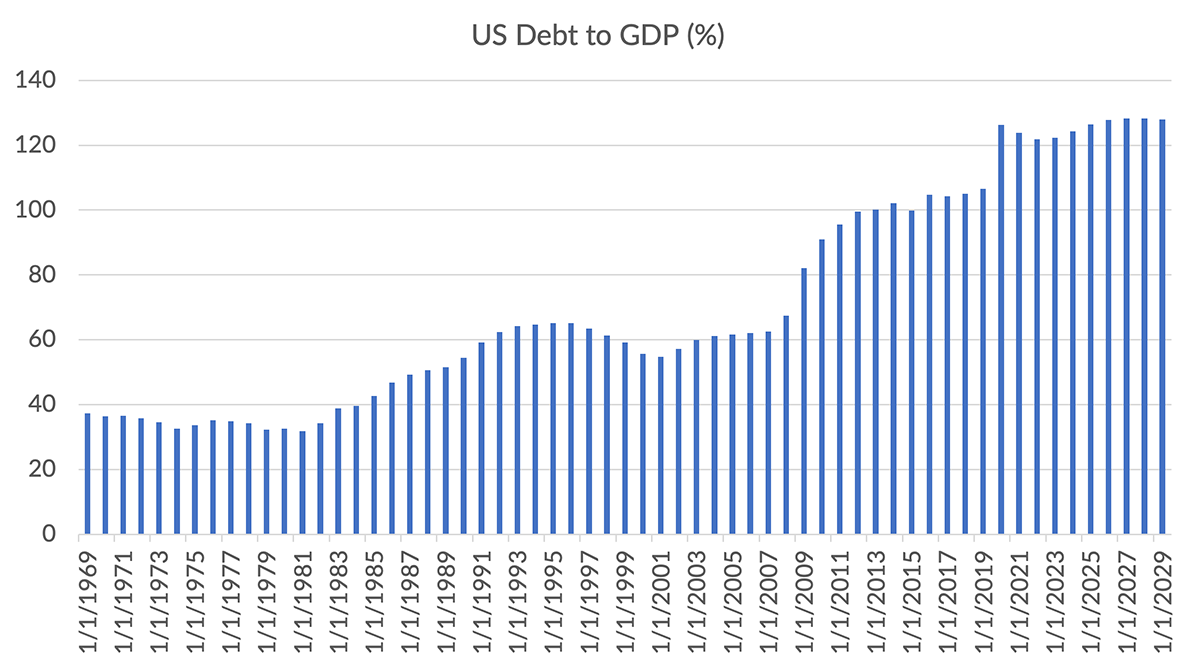
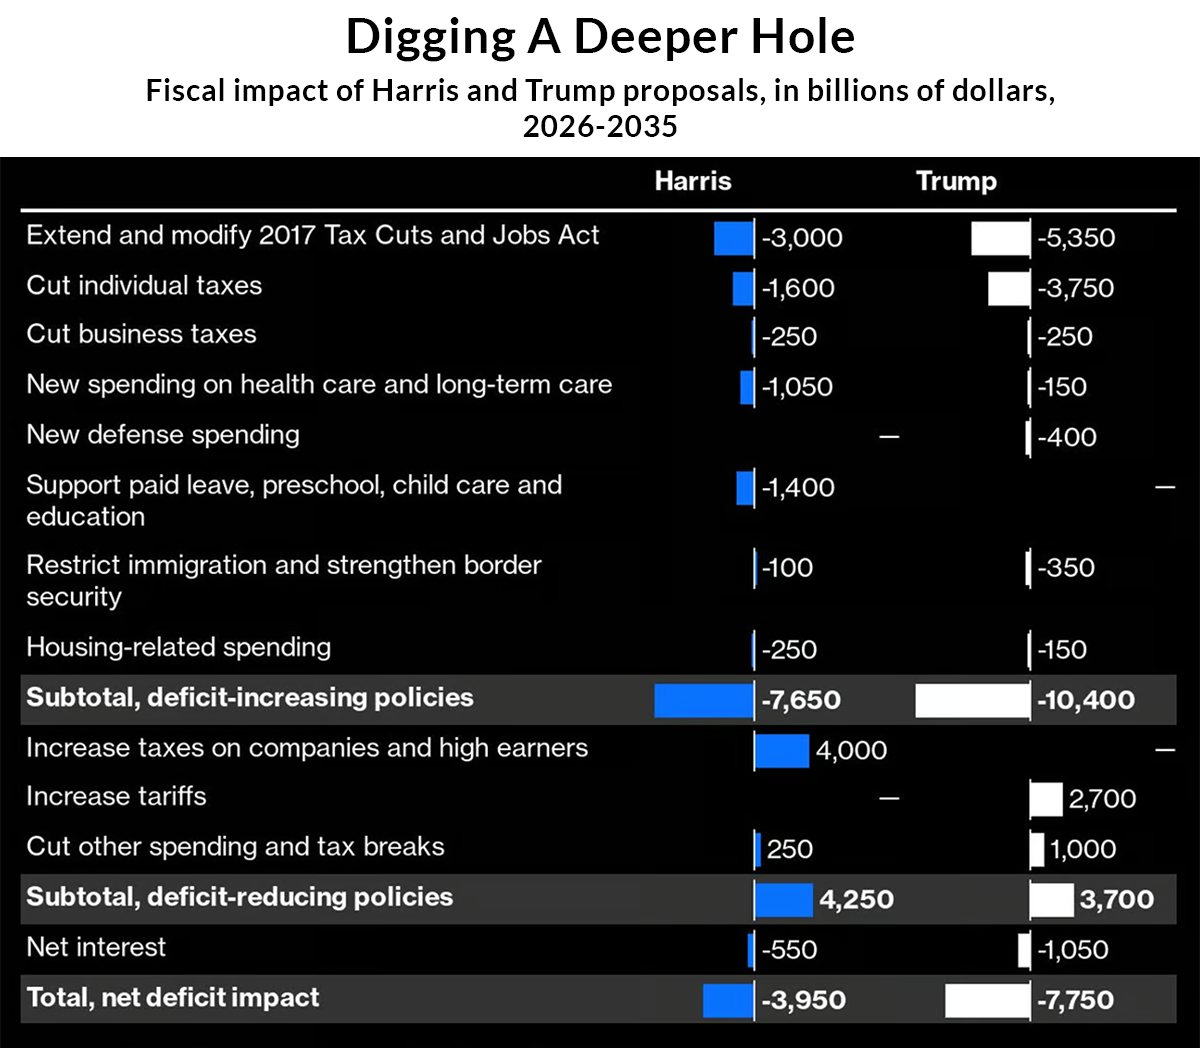
While advocating that our clients stay disciplined and focused on their financial goals, it would be irresponsible for us not to point out some of the looming risks that we see over the next 7 to 10-year cycle going forward. As mentioned in previous letters, we see the growing levels of our nation’s fiscal indebtedness – see the US Debt to GDP chart below, as a source of potential systemic risk, especially since neither party at the 2024 election laid out credible plans to tackle the problem. On the contrary, both candidates laid out expansionary fiscal programs which, according to the Congressional Budget Office, would lead to sustained deficits over the next 10 years – see chart marked “Digging a Deeper Hole” below.

v. Source: Bloomberg, CBO.

vi. Source: Bloomberg, Committee for a Responsible Budget. Note: Numbers are rounded to the nearest $50 billion.
Implications
While it is admittedly difficult to predict how the growing fiscal indebtedness will play out, we feel it is prudent risk management to make some precautionary adjustments to mitigate tail-risk in our clients’ strategic asset allocations. In the investment realm, a bias towards higher quality stocks with strong balance sheets seems appropriate given that corporate borrowing costs may come under pressure with elevating Treasury bond yields. Similarly, in the fixed income markets, a bias towards short and intermediate duration and floating rate coupons provide protection without significant diminution of annual interest receipts. And finally, allocations to “real assets” such as Infrastructure and certain types of real estate leases backed by high quality properties could be part of the overall asset allocation of qualifying clients.
Recommendations
 vii. Source: FTSE, Russell All World Index Series Monthly Review.
Beyond risk mitigation measures in the investment portfolio, we urge our clients to plan for the prospect of higher taxes as we navigate past the next few years. In addition, the prospect of frozen or diminished levels of benefits from entitlement programs such as Social Security and Medicare should also be factored into saving/investing and spending habits. Besides focusing on long-term goals and taking some pre-emptive risk management steps, our other recommendation for client investment portfolios is to prevent large mismatches between assets and liabilities. Most of our clients are US based, investing to fund long-term liabilities that are likely to be incurred within the United States. As such, having a “home country” bias in the investment portfolio may be a prudent alignment. It follows that overweighting US assets entails underweighting foreign assets. However, the weight of history suggests that overweighting US assets may be a winning strategy. The chart above shows the composition of global public equity market capitalization since 1900. Note the tremendous expansion of the value of US businesses- and by extension equity returns, relative to that of other countries. If the United States maintains the best legal, governance, and institutional frameworks and maintains its commitment to private property rights, we do not see any reversal in our country’s dominant position in the global marketplace.
*Private assets may require accreditation. All figures are hypothetical and do not reflect fees. Past performance is not an indicator of future performance. Your results may vary.


