Understanding US Treasury Yields and Fiscal Deficits
As fiscal deficits rise and forward bond yields climb, the shape of the yield curve is signaling a shift. I feel it is appropriate to give you some context of the future of US Treasury Yields given that Moody’s downgraded our nation’s credit rating from Aaa to Aa1 on March 16th, following the Trump Administration’s plans to provide additional tax cuts as part of an extension of the 2017 Tax Cuts and Jobs Act (“TCJA”) which is otherwise slated to sunset in the current fiscal year. The Congressional Budget Office (CBO) and Joint Committee on Taxation (JCT) project that the House-passed bill, which includes extending parts of the TCJA, would increase the federal deficit by $3.8 trillion between 2026 and 2034. Other analyses, like the one from the Penn Wharton Budget Model, estimate the deficit increase at nearly $3.3 trillion over the same period, even when accounting for economic growth. With all the current market focus on tariffs, I feel movements in the shape of the yield curve has received little attention.
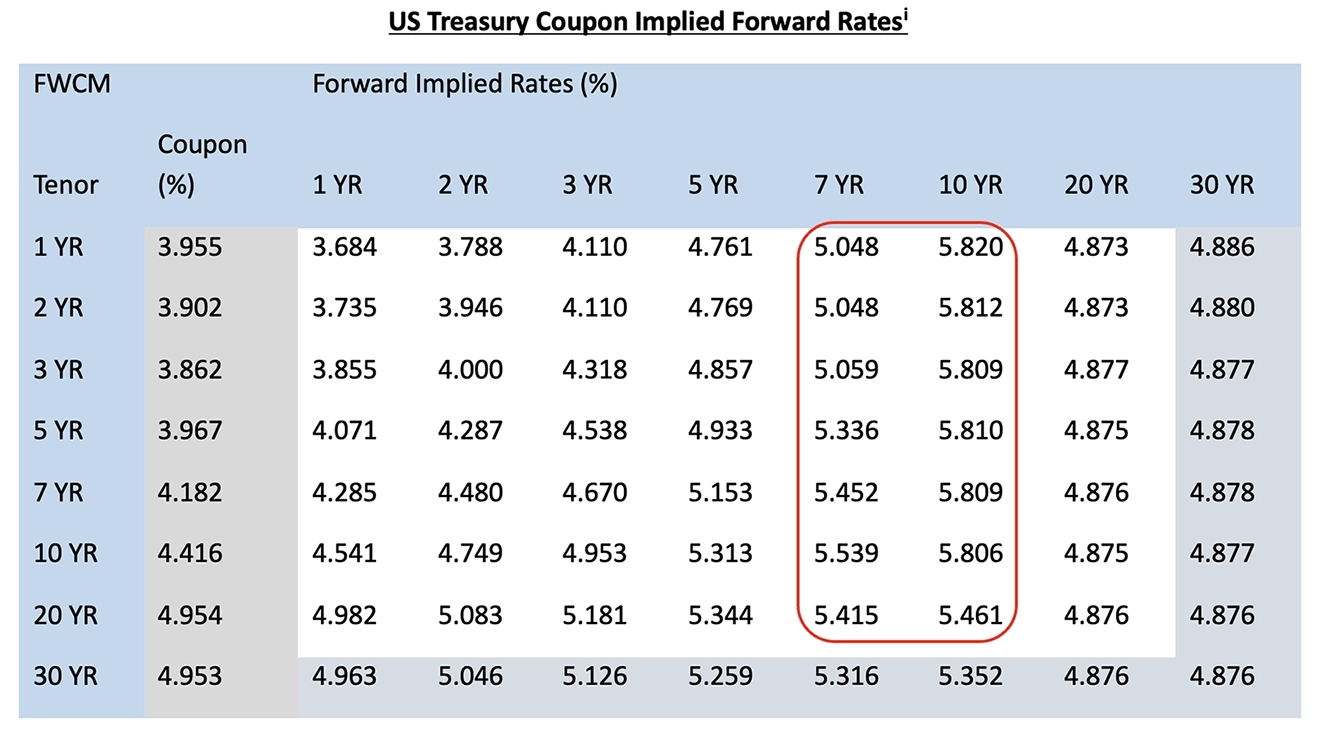
Source: Bloomberg
Implied Forward Rates: What the Bond Market is Pricing In
The table above shows the yields on US Treasury notes/bonds with maturities ranging from one year to 30 years – see column marked Coupon (%). The one-year spot rate at COB on Friday, May 29th was about 3.96%. Going down the column, five-year yields were at 3.97% while the 10-year and 30-year bonds closed the week at 4.42% and 4.95% respectively. The more interesting observation is the steepness of the curve. While rates between one and five years are essentially flat, the difference between the yield on the five-year note and the 30-year bond is approximately 100 basis points or 1%. The white areas of the table are implied forward rates, which is to say, since we know what the one- and two-year rates are, we can impute what the bond market is pricing the one-year treasury rate, one year from now. In today’s market, the one-year rate is 3.96% and the two-year rate is 3.90%, implying that short term rates are expected to fall. We can see this in the pricing of the 1YR by 1YR forward rate, which is priced at about 3.68%. In a similar vein, look at the steep increases in Treasury yields on maturities ranging from seven to 30 years. Using the similar math logic we used to analyze the 1YR by 1 YR forward rate earlier, the steepness of the curve beyond five years is driven by the market pricing in higher bond yields across the US Treasury curve as we work through the next cycle – look at the forward rates on all maturities seven and 10 years into the future – where Treasury yields are priced to approach 6% across most maturities by the middle of the next decade.
What does this mean? The bond market, like the rating agencies, are increasingly concerned about fiscal profligacy and pricing in higher interest rates as we work our way through the next cycle.
Are forward rates necessarily the future bond yields?
No, they aren’t. Forward implied rates are simply current pricing of future bond yields and subject to market movements. However, investors can indeed “lock in” forward rates through forward rate agreements if they want to hedge against interest rate uncertainty. For Trajan Wealth investors, the more pertinent question is the extent to which market rates (current of forward) reflect the total return potential of a well-diversified, high quality US bond market allocation. Research shows that starting yields have historically set a ‘floor’ for forward looking returns.
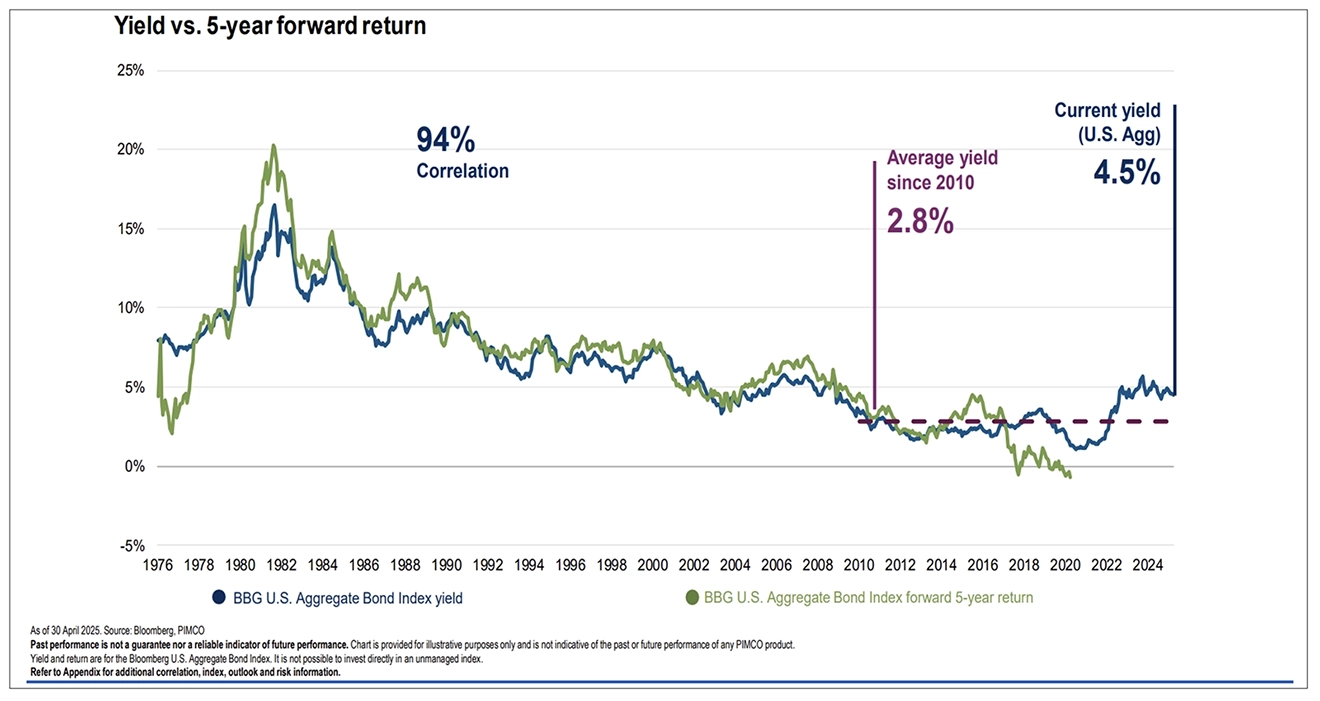
The blue series in the above chart shows the time series of yields on the US Bloomberg Aggregate index. The green series shows the forward five-year index return. Barring the sudden spike of inflation in the mid-1970s and more recently in 2021 and 2022, starting bond yields have been a steady predictor of subsequent five-year bond market returns with a correlation of 94%ii. Furthermore, returns have generally matched or exceeded the starting yields barring a few periods of exception. As of May 30, the yields on core US Bonds (the Bloomberg Aggregate index) is 4.71%iii.
Relative Value: Stocks vs. Bonds and Capital Appreciation Potential
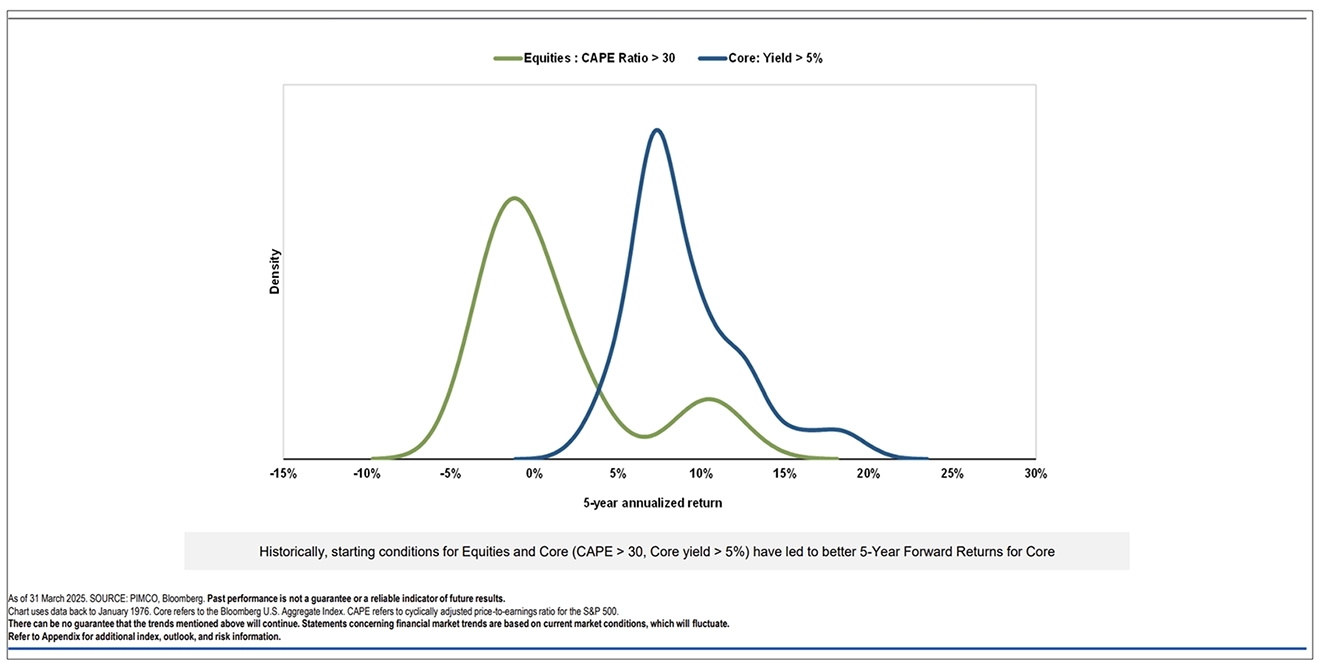
In the final analysis, the question for investors is whether the bond market represents attractive value in the current environment. I feel that after a decade and a half of minimal returns, the US investment grade bond market has become interesting once again. This view is based on not just higher entry yields, but also the relative value levels versus stocks. For this analysis, consider the current yield on the Bloomberg Aggregate Index – approaching 5% versus the Cyclically Adjusted PE Ratio (“CAPE”) on the S&P 500. The cyclically adjusted price-to-earnings ratio, commonly known as CAPE or Shiller P/E, or P/E 10 ratio, is a stock valuation measure usually applied to the US S&P 500 equity market. It is defined as price divided by the average of 10 years of earnings (moving average), adjusted for inflation. As such, it is principally used to assess likely future returns from equities over timescales of 10 to 20 years, with higher-than-average CAPE values implying lower than average long-term annual average returns. As of May 30 the CAPE ratio is 34.8x, which is significantly above its long-term median of about 16.8x.
The above chart shows the historical distribution of subsequent five-year returns during periods in which valuation levels in the stock (CAPE > 30x) and bond markets (yields ~ 5%) were similar to valuation levels todayiv. Note the higher potential of returns and tighter outcomes (lower volatility) in the bond market (blue series) vs. the equity market (green series).
Key Takeaways for Financial Planning and Asset Allocation
- Current bond yields offer an attractive entry point and by the evidence of history, should generate positive real returns if inflation remains below 3.0% to 3.5%.
- The market is pricing in 5% to 6% bond yields on the trajectory of persistent fiscal deficits and rising US national debt.
- At current valuation levels, based on history, return potential looks more favorable in the bond market compared to the equity market. However, it is incorrect to interpret valuation levels as the sole predictor of return potential. To be sure, rich valuations in the equity markets may reflect many positive factors such as enhanced productivity driven by the Artificial Intelligence (“AI”) revolution which could generate positive earnings surprises.
- However, after almost a decade and a half of minimal real returns, bonds look primed to enhance purchasing power and should be part of overall asset allocations. The exact weightings depend on investor time horizons and risk tolerance levels.
iSource – Bloomberg
iiSource – PIMCO
iiiSource – Bloomberg
ivSource – PIMCO
