Here’s what I like about investing in banks:
- Their deposits tend to be sticky. Retail customers set up direct deposit for their paychecks, automatic bill pay for their mortgages and car loans, and put their debit cards on file with online merchants. Business customers link their bank accounts with various customers and suppliers, and may have a lending relationship with the same bank. After setting all that up, it’s a hassle to change banks, so depositors accept low or zero interest rates on their account balances. To the extent banks have economic moats, this is the main source: customer switching costs that create a funding-cost advantage.
- In contrast to most companies, bank earnings can benefit from higher interest rates, which may provide diversification. Some deposit accounts don’t pay any interest, but even interest-bearing accounts tend to adjust their rates relatively slowly. Depending on the bank’s asset mix, interest income can adjust more quickly to an upward shift in the yield curve, with higher returns on cash, variable-rate loans, and maturing securities that are rolled over.
- Bank stocks usually trade at low price/earnings multiples. As long as earnings are sustainable, we don’t need much organic growth to achieve a decent return: dividends and share buybacks can get us most of the way there.
Unfortunately, the list of things I don’t like about banks is much longer:
- They’re economically sensitive. If the overall economy isn’t doing well, banks are probably doing worse.
- That starts with credit risk. Borrowers are more likely to default on loans during a recession. Even with detailed disclosures, it can be difficult or impossible to assess credit exposures that may be hiding in a bank’s balance sheet.
- Banks also have interest-rate risk. The sudden and extreme jump in interest rates over the past year is the main cause of recent distress in the banking sector—more on that in a moment.
- On top of fundamental risks, we have to worry about sentiment among depositors, counterparties, and investors. Even a structurally healthy bank could fail if too many depositors withdraw their money at once, counterparties refuse to work with the bank, or investors get nervous and decline to provide financing.
- Banks are complex. They require an inordinate amount of time, effort, and expertise to properly understand. No matter how much effort you put in, it’s never enough.
- Banks are highly regulated. If a small group of employees does something unsavory, it can result in millions or billions of dollars in fines and lawsuits. Bad headlines and negative attention from Congress are routine. Regulatory capital requirements can pressure returns on equity, and new regulations can suddenly erase past revenue sources.
- Banking is extremely competitive. Loans and deposit accounts are commoditized—there are thousands of competitors with nearly identical products. Long-time customers might abandon their bank to save 0.25% in annual interest.
- Fee-based revenue lines—such as wealth management, investment banking, and mortgage origination—also face intense competition. Some of these are in secular decline as market share shifts to less-regulated financial technology companies or boutique operators.
- All of the above is compounded by the high degree of leverage in banking. It’s common for assets to be 10 times equity, which implies a 1% decline in the value of assets will cause a 10% decline in the value of equity.
- Lastly, banks are highly dependent on management. A few bad management decisions can quickly turn a healthy bank into a failing bank.
Banking 101
The old joke was that banks follow the 3-6-3 rule: “Borrow at 3%, lend at 6%, play golf by 3 pm.” The joke stopped working during the decade-plus of extremely low interest rates that began with the 2008-09 financial crisis. “Borrow at 0%, lend at 1.5%, skip golf to work on a regulatory filing” doesn’t have quite the same ring to it.
Within this simple business model, many things can go wrong. The essential job of all banks is risk management. Most of their “borrowing” is in the form of demand deposits. Almost anyone can open an account, and customers expect their money to be 100% secure and available. They want to make deposits and withdrawals any time they please, without asking the bank’s permission or warning it ahead of time. In other words, deposits are short-term, liquid, and guaranteed.
Banks don’t put depositors’ money in a vault—they lend it out. There are three main forms of “lending”: (1) cash and equivalents, such as deposits at other banks or the Federal Reserve; (2) securities, which are usually high-grade bonds such as Treasuries or agency mortgage-backed securities; and (3) loans, such as mortgages, auto loans, and credit card balances. To make a profit, banks need to lend at a higher interest rate than what they pay depositors, so their assets are longer-term, less liquid, and riskier than their deposits.
This asset-liability mismatch is fundamental to the business model of banking. It needs to be carefully managed, but it can’t be eliminated if a bank hopes to earn a reasonable return on its capital.
The Run At Silicon Valley Bank
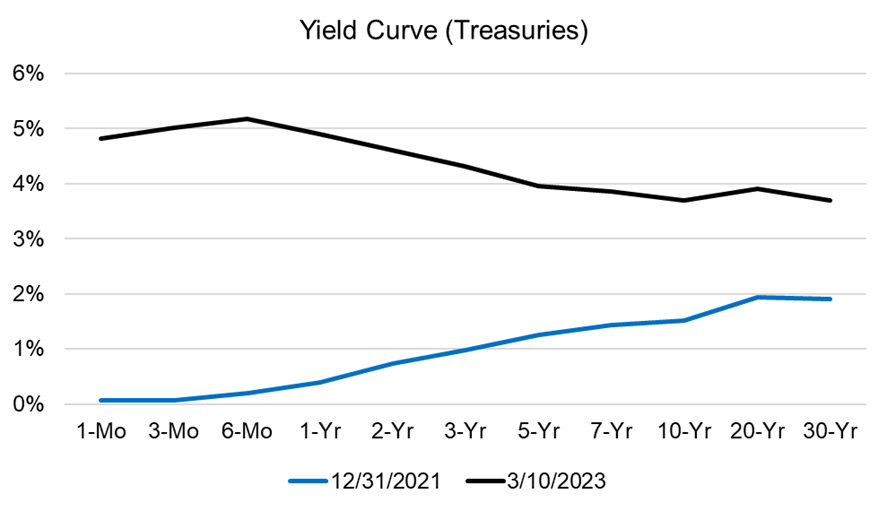
The 2008-09 financial crisis was mostly about credit risk. Banks made bad loans, especially subprime mortgages, that borrowers couldn’t afford to pay back. Credit risk hasn’t really been a factor in the recent banking turmoil. Instead, interest-rate risk is playing a starring role, compounded by liquidity issues and depositor panic. The below chart shows the yield curve (using Treasuries) as of December 31, 2021, and March 10, 2023.

Source: U.S. Treasury Department
Friday, March 10, is the day Silicon Valley Bank (SVB) was put into FDIC receivership. Several other regional banks have experienced financial difficulties, but SVB was the one that really caused investors to start paying attention. It became the second-largest U.S. bank failure in history by size of deposits, behind only Washington Mutual (which failed in 2008).
The immediate cause of Silicon Valley Bank’s failure was a run on deposits. On Thursday, March 9, depositors attempted to withdraw $42 billion from the bank in a single day—about a quarter of all deposits. It would be difficult for any bank to meet withdrawals of that scale and speed, but SVB had some unusual characteristics that made it especially vulnerable to a bank run:
- SVB mostly served startups and venture capitalists in Northern California. This is a tight-knit group, and rumors travel fast. As more people questioned the health of SVB’s balance sheet, its stock price tumbled. Venture capitalists took notice and started advising their portfolio companies to pull deposits. A bank run became a self-fulfilling prophecy.
- About 94% of Silicon Valley Bank’s deposits were uninsured, meaning they were above the $250,000 FDIC limit. Pulling deposits was the rational decision: There is zero upside but significant downside to sticking with a failing bank. At the time, it wasn’t clear if depositors would be made whole, or how long it might take to regain access to their money. For startups, that could mean being unable to pay employees or vendors, and their businesses might fail.
In the end, regulators stepped in to guarantee all deposits, which were generally available by Monday, March 13. As for what prompted the original concern about SVB’s balance sheet, that’s where the yield curve comes in. In the boom year of 2021, startups raised boatloads of venture capital money, and much of it was deposited at Silicon Valley Bank. The bank’s deposits increased 86% that year to $189 billion. Two-thirds of its deposits didn’t pay any interest at all, and the other third only cost the bank about 0.14%.
Management had to decide how to invest this sudden influx of deposits. As described above, they had three main choices: (1) Cash and equivalents, which in 2021 were yielding just 0.10%. Management declined this option—cash and equivalents on the balance sheet were actually lower at the end of 2021 than they had been a year earlier. (2) High-quality, longer-duration securities, which offered higher yields. For example, the 10-year Treasury was yielding 1.52% at the end of 2021. This was management’s preference—about 90% of the incremental deposits that came in during 2021 were invested in securities. Substantially all of the new securities were classified as “held-to-maturity,” which meant that fluctuations in their market value wouldn’t be reflected in SVB’s balance sheet as long as the securities weren’t sold. (3) The final option was loans, on which SVB could earn a yield around 3.5%. However, loans came with considerable credit risk, especially given the nature of SVB’s client base.
I imagine SVB’s management thought they were being prudent by investing mostly in securities instead of loans. The vast majority of the held-to-maturity portfolio was in agency mortgage-backed securities and municipal bonds with minimal credit risk, but with maturity dates 10 or more years in the future. Management didn’t seem to grasp the interest-rate risk. If interest rates suddenly spiked, as they did in 2022, SVB might have to pay more to depositors while the income from long-term securities stayed the same. Worse, the mark-to-market value of SVB’s portfolio would decline precipitously, eroding the bank’s equity cushion. SVB’s unrealized losses on held-to-maturity securities were disclosed in a footnote: about $15 billion at year-end 2022, against just $16 billion of equity. The underlying cause of SVB’s bank run was that people started to notice and worry about these mark-to-market losses.
What should management have done differently? We know now that they should have told themselves something along these lines: “Tech startups are booming. Deposits have come in very quickly, and they’re from a tight-knit group of depositors who are prone to herd mentality. We better keep almost all of the money in cash, even though yields are basically zero, just in case all the depositors decide they want their money back at once.” That’s easy to say with 20/20 hindsight, but you can see why management didn’t think that way at the time. First, it’s easy to get caught up in the excitement of a bubble. Second, interest rates had been extremely low for over a decade. And third, because management’s job is usually to maximize profits, not accept near-zero yields just in case something bad happens. The CEO would have seemed like Chicken Little at Mardi Gras.
Is Charles Schwab At Risk?
The failure of Silicon Valley Bank raised fears about other financial institutions facing similar issues. We have a small position in Charles Schwab SCHW, so I’ve been paying especially close attention to the company.
I want to emphasize that I don’t have any concerns about using Schwab as a custodian and brokerage. By law, securities held at Schwab must be segregated from Schwab’s balance sheet—they are untouchable even if the company went bankrupt. Cash held at Schwab is protected up to $250,000 by either the FDIC or SIPC, but even above those limits, regulators’ actions have made clear they intend to protect uninsured deposits. The company has additional insurance coverage through Lloyd’s of London. Better yet, they have access to enough liquidity—including through government loan facilities—that they could redeem substantially all deposits tomorrow if it came to that.
Schwab is very different from Silicon Valley Bank in most respects, but they have one disconcerting thing in common: large unrealized losses on securities. At year-end 2022, Schwab’s held-to-maturity security portfolio had unrealized losses of $14.1 billion against total equity of $36.6 billion. That doesn’t sound so bad, but Schwab also had $20.7 billion of goodwill and other intangibles related to past acquisitions. If Schwab were forced to mark its entire portfolio to market value, including small unrealized losses in its loan portfolio, its tangible equity would be wiped out. The main reason is that Schwab’s portfolio is heavily weighted to securities, which have observable market prices. Loans account for less than 8% of interest-earning assets, distorting comparisons to other banks. But it also reflects management’s questionable decision to invest in longer-dated securities. About 56% of Schwab’s securities portfolio (at cost) has a maturity date 10 or more years in the future.
Depositors panicked about mark-to-market losses at SVB, turning a footnote problem into a liquidity problem. What’s to keep depositors from doing the same at Charles Schwab? Fortunately, that’s where the differences come in. More than 80% of client cash at Schwab Bank is FDIC-insured, compared with only about 6% at Silicon Valley Bank. SVB’s depositors had good reason to fear they might lose their deposits; Schwab’s depositors do not. That’s especially true after seeing regulators’ response to SVB and other recent bank failures, where all depositors were made whole.
Schwab’s deposits also come from a much larger and more diverse customer base than at SVB. The company has 34 million active brokerage accounts. It oversees $7 trillion of client assets, implying that the average client has around $209,000. The bank finished the year with $367 billion of deposits, or about $10,900 per brokerage account.
It’s important to remember why Schwab has deposits. Most customers probably aren’t even aware that Schwab owns a bank—the company is, first and foremost, a brokerage. Deposits in Schwab Bank come predominantly from account “sweeps.” Schwab moves cash that is left in clients’ brokerage accounts to the bank, where it can invest the money and earn interest. Clients don’t have the option to change where their cash is swept to, but they can avoid the sweep altogether—and earn higher interest—by investing in a money-market fund. That requires an active decision on the part of the client, but this is what a “bank run” would look like at Schwab. Clients probably wouldn’t leave Schwab altogether, but they might draw down deposits by investing their cash.
As of Q4 2022, Schwab was paying 0.46% interest on deposits. If this money were moved to a money-market fund or high-yield online savings account, clients could earn about 4 percentage points more in interest, or about $430 per year for the average account. (To be fair, cash isn’t spread evenly across accounts—missed interest could be much higher or lower depending on the client.) Some clients care about forgone interest and will make the effort to maximize returns on their cash. Deposits were down 17% last year because of “cash sorting” (management’s euphemism for deposit outflows), and with the recent negative headlines, we may see even more deposits shift in the near term. However, I expect most deposits will stick around thanks to a combination of client ignorance, apathy, inertia, and friction.
Clients typically aren’t holding cash at their brokerage on purpose. Maybe they made a deposit or 401K contribution and haven’t decided what to invest in yet. Or they received a dividend or interest payment, or they sold something without reinvesting the proceeds. Advisors may need to hold cash to facilitate trading, for pending withdrawals, or to collect fees. Maybe the client didn’t realize how much interest income they were giving up. Or they realized but didn’t think it was worth the trouble to constantly transfer money in and out of a money-market fund to earn a few hundred dollars per year.
I’ll admit that I’m not entirely comfortable with this investment thesis. The rebuttal is obvious: “It’s really not that hard. Clients can and should move their cash to whatever safe option will earn them the most interest income.” But if you think about it, ignorance, apathy, inertia, and friction are the foundation of much of the financial services industry. If people were 100% rational, they might never keep money in a zero-interest checking account, pay an ATM fee, or borrow on a credit card. Indeed, I believe this is the primary reason that Schwab chose to monetize through the bank sweep program. Clients are very sensitive to explicit fees—such as trading commissions—but largely oblivious to forgone interest.

Source: Company reports, Trajan Wealth estimates
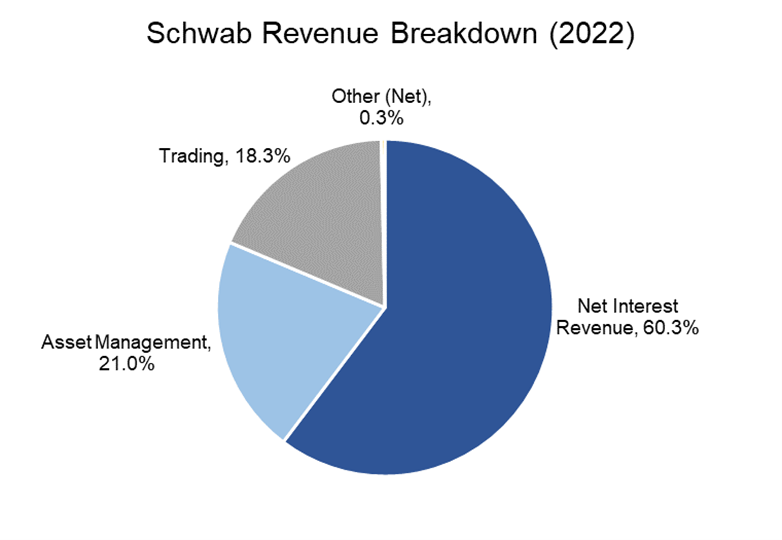
Trading: The brokerage business is intensely competitive. Trading commissions had been declining for decades and finally settled at “zero” a few years ago for most common trades. Even so, trading accounted for 18% of Schwab’s revenue last year. About half was commissions, which Schwab still charges on certain derivatives, over-the-counter securities, foreign securities, individual bonds, broker-assisted trades, and other special situations. The other half was payment for order flow, which is money the company gets for routing trades to specific market-makers. Payment for order flow has been the subject of regulatory scrutiny, but Schwab would argue that it drives better trade execution for clients.
Asset Management: Schwab offers various proprietary money-market funds, mutual funds, exchange-traded funds, and fee-based advice solutions. It also earns fees from third-party mutual funds and ETFs that it makes available on its platform, often with zero transaction costs. Asset management accounted for 21% of revenue last year, of which about 63% was from proprietary Schwab funds and advice solutions. To the extent bank deposits shift to Schwab money-market funds, the company can still earn fees around 0.26%, but that’s well below its net interest margin in the bank.
Net Interest Revenue: Net interest revenue accounts for 60% of Schwab’s total. Ironically, one of the reasons we invested in Schwab was that we expected it to benefit from higher interest rates. Despite deposit outflows, Schwab’s net interest revenue was up 29% last year thanks to a dramatic increase in the yield on cash, margin loans, variable-rate bank loans, and available-for-sale securities that matured and were rolled over. Overall, Schwab’s yield on interest-earning assets jumped to 1.96% from 1.41%, while the yield it pays on interest-bearing liabilities only increased to 0.27% from 0.09%. Schwab’s net interest margin improved to 1.78% from 1.45%, and by the fourth quarter, it was all the way up to 2.24%.
There is room for further upside. As of Q4 2022, almost two-thirds of Schwab’s interest-earning assets were in securities yielding an average of 1.8%. Similar securities purchased today would have a yield in the 3%-4% range, and the Q4 yields on cash and loans were below current market levels as well. In addition, Schwab has $123 billion in off-balance-sheet “bank deposit accounts” (BDA) that carried over from its 2020 acquisition of TD Ameritrade. These deposits are swept to TD Bank in exchange for a fee of less than 1%, but Schwab is allowed to move $10 billion per year to its own balance sheet, which should further improve net interest income.
Schwab’s Earnings
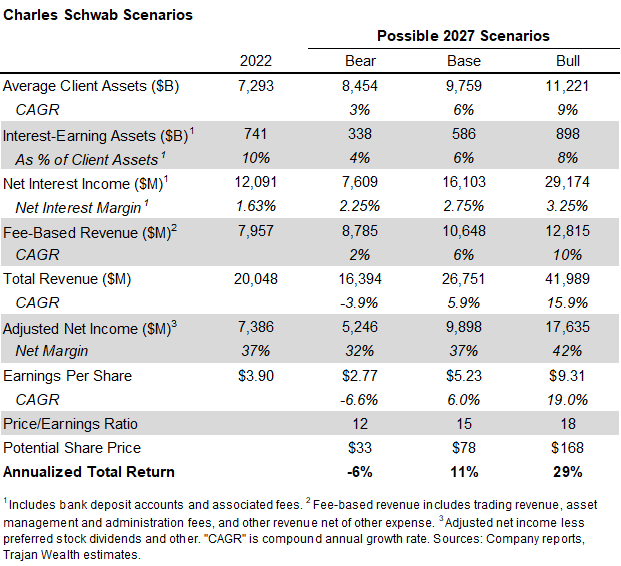
I’ll describe three possible scenarios for 2027 (five years from 2022)—a base, bull, and bear case. There are many factors to consider when estimating Schwab’s long-run earnings power:
- Schwab has been prolific at gathering assets thanks to its leading position with self-directed investors and independent registered investment advisors (RIAs). The company brought in $428 billion of net new assets last year, representing organic growth of 5%. Schwab should also benefit from market appreciation on assets it already holds. For the scenario analysis, I’m going to assume annual asset growth of 3%-9%, with the base case at 6%.
- Schwab’s long-term net interest income will depend on the pace and extent of cash sorting, how quickly it can roll over its securities portfolio, and the level of interest rates when that happens. Including BDA, Schwab averaged about $741 billion of interest-earning assets last year. The funding for these assets comes from bank deposits (mostly cash sweeps from the brokerage), “payables to brokerage clients” (analogous to deposits, but kept at the brokerage), short- and long-term debt, and equity. With clients putting more of their cash to work, interest-earning assets were down to about $647 billion by December. Before the recent turmoil, management was expecting deposit outflows to level off: If a customer didn’t switch to a money-market fund when rates were at 4%, they probably won’t switch for 4.5%. But given recent events, I think we have to assume deposit outflows will continue for some time.This is the greatest source of uncertainty for Schwab. As a base case, I’ll assume that interest-earning assets drop from 10% of client assets in 2022 (9% as of December) to 4%-8% by 2027, with 6% in the base case. The offset to deposit outflows is that Schwab should enjoy a meaningfully higher net interest margin. Including BDA fees, I’m assuming the net interest margin will be 2.75% by 2027, with the bull and bear cases 0.5 ppt higher or lower, respectively.
- I grouped trading and asset management revenue together as “fee-based revenue” and will assume that it grows roughly in line with client assets. The actual result will depend on market volatility, how often clients trade, any regulatory changes to payment for order flow, whether Schwab can retain lost deposits in its money-market funds, the mix of proprietary and third-party asset management products, and the extent to which Schwab can up-sell clients to higher-priced advice offerings.
- Ameritrade and Schwab were very similar, which created lots of opportunities for both revenue and cost synergies. Some synergies have already been realized, but there’s more to come. On the revenue side, Schwab can sell its investment products and advice solutions to Ameritrade clients, while giving its own clients access to Ameritrade’s sophisticated trading tools. Schwab will continue to move client cash from TD Bank to its in-house bank, where it can earn more interest income. On the cost side, Schwab and Ameritrade have duplicative technology platforms. The company is planning to transition most Ameritrade clients to the Schwab platform this year, and then retire Ameritrade’s systems.
- Synergies aside, Schwab’s business model involves relatively high fixed costs and low marginal costs. By my estimate, the company’s adjusted net margin was around 37% last year, up from 26% five years earlier. If Schwab can grow revenue in the mid- to high-single-digits, it should be able to maintain or further expand margins. If revenue declines, it will be very challenging to sustain recent margin levels. I’ll assume a flat net margin in the base case, and five percentage points higher or lower in the bull and bear cases.
- Mercifully, regulators don’t require Schwab to mark securities to market value (both available-for-sale and held-to-maturity) when calculating capital ratios. The company’s tier 1 leverage ratio ended 2022 at 7.2%—well above the 4% regulatory minimum. If Schwab had to sell securities for a loss, it might erode capital, but that seems unlikely given the company’s access to various short-term government funding sources. Still, in light of recent events, it would be prudent for management to strengthen its capital position further and prepare for possible regulatory changes. For the scenario analysis, I’m going to assume no share buybacks over the next five years, but that the dividend continues to be paid.
- Lastly, the price/earnings ratio is always a question mark. In recent years, Schwab tended to trade with a P/E in the high teens or low 20s, reflecting both solid organic growth and anticipated benefits from higher interest rates. With the stock down more than 40% from its 52-week high, it’s now trading for just under 13 times trailing earnings. There’s a decent chance the P/E will bounce back as the dust settles, so I assumed a P/E of 12x, 15x, and 18x in the bear, base, and bull cases, respectively.
The table below summarizes these three potential scenarios. Beginning from a stock price of around $50/share, the base case implies an 11% annual return over the next five years, with a range of -6% to +29%.

Source: Company reports, Trajan Wealth estimates
Speak to a Trajan Wealth financial advisor today!
Bank on the investment team that takes a closer look.


