“If you’re investing with a long-time horizon, having an equity bias makes sense; stocks go up in the long run.”
~ David Swensen, American Investor
Market Returns & Outlook
The markets continued trending lower in September, with stocks and bonds once again posting negative returns for the month (see table below). Year-to-date returns across major equity indexes, however, range from about 3.6% in the Small and Mid Cap sector to a strong ~27.1% in the tech heavy NASDAQ, substantially outperforming historical annual averages (note, we are only 9 months into 2023) spanning multiple decades. However, the bulk of domestic equity returns have been driven by the “Magnificent Seven” (AAPL, NVDA, MSFT, AMZN, NFLX, META and GOOG). The broader equity markets posted modest gains and the US Small/Mid Cap sector is now underperforming its long-term return trends. A lot of the tapering in risk asset performance is driven by the growing view that monetary authorities will hold rates at 5%+ levels for a longer period than anticipated earlier, given inflation readings remain persistently above the Federal Reserve Bank’s target. In accordance with this expectation, the US bond market is now lower, resulting in a negative YTD return of (1.2)% as of the end of September, with benchmark 10-year US Treasury yields up a sharp 55 basis points or 0.55% during the month.
| Index | YTD TR (%) | August 2023 |
|---|---|---|
| US Large Cap – S&P 500 | 13.05% | (4.76)% |
| US Large Cap – Tech Heavy NASDAQ | 27.11% | (5.77)% |
| International Equity – MSACWI ex US | 5.82% | (3.12)% |
| US Small/Mid Cap – Russell 2500 | 3.57% | (5.59)% |
| Bloomberg Aggregate Intermediate Bond Index | (1.15)% | (2.49)% |
Our outlook for future equity and bond returns over the next cycle merits a certain level of caution. While, as always, we are not in the business of predicting future returns, our valuation and risk-based approach conditions us to make an honest assessment of current asset values, and the outlook for the two main components that drive changes in asset values, namely growth and interest rates.
In this regard, the basic premise of asset class returns is that they earn a premium over risk free assets over market cycles. The size of that premium is a function of the anticipated excess cash flows (over the risk-free asset) that the risk asset is expected to generate and how variable (or volatile) the excess cash flows may be. If it is highly conditioned on future growth, the asset is “high beta,” and investors require the risk premium to be high. Conversely, if the excess cash flows are less conditioned on growth, the asset is “low beta,” and the size of the premium is low. And to be sure, if an asset’s cash flow is certain, regardless of growth, it is essentially a risk-free asset, and there is no risk premium or excess anticipated cash flows.
The growth aspect is particularly important at this point of the economic cycle since returns on the risk-free asset – essentially, short-dated US Treasury bills have climbed to a level above the rate of inflation following the US Federal Reserve Bank’s 5.25% to 5.50% increase in the overnight Fed Funds rate since March 2022.
US Treasury Bill Yield and Real Yields on the US 10-Year Treasury Note
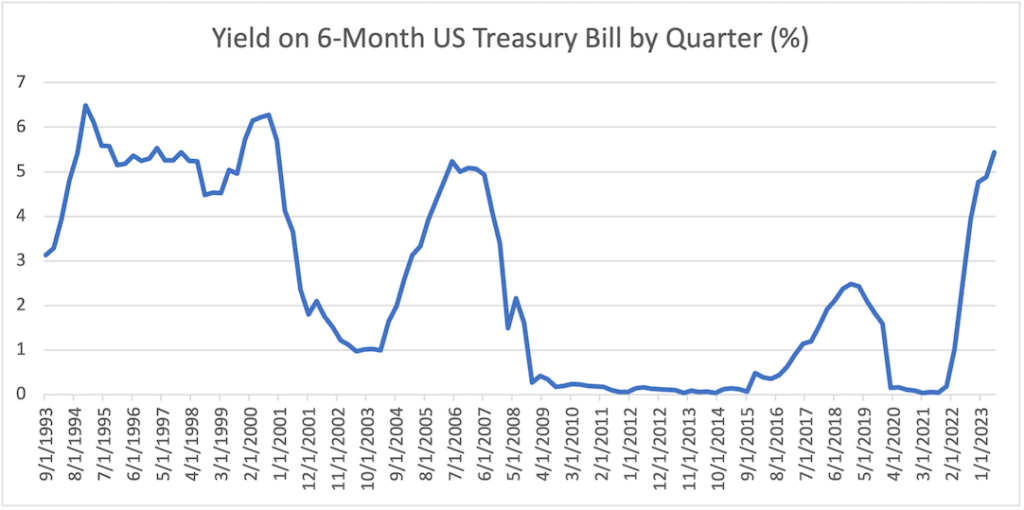
Chart 1. Source: Bloomberg, Trajan Analytics
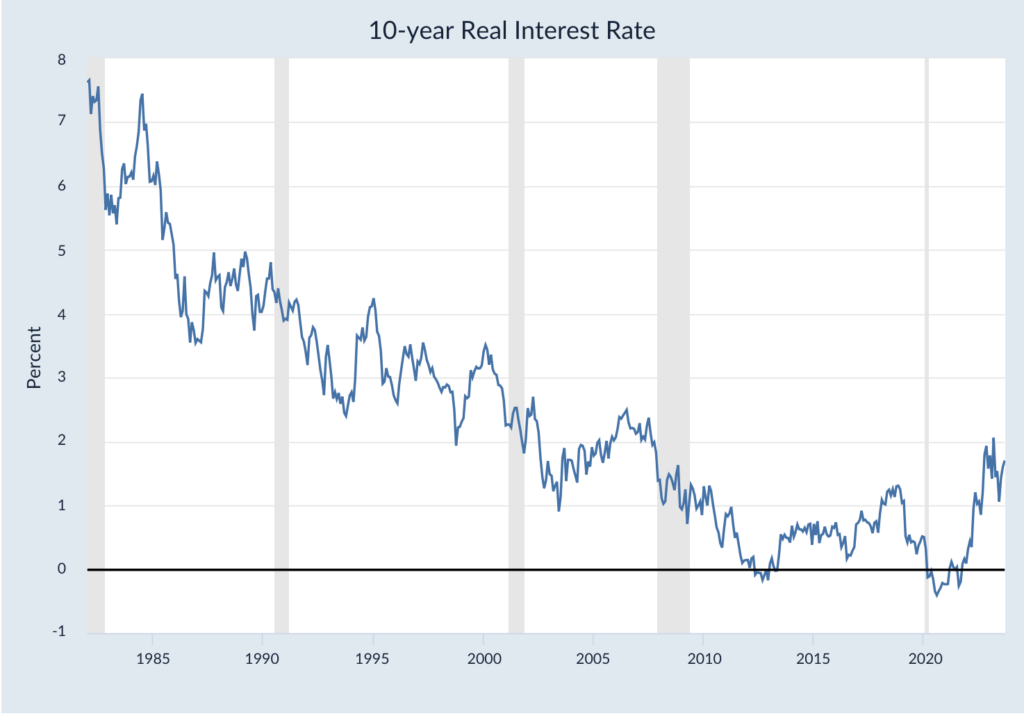
Chart 2. Source: Federal Reserve Bank of Cleveland
As depicted in Chart 1 above, the yield on the risk-free 6-month US Treasury bill is now just below 5.40%, almost 170 basis points over the Urban Consumer Price Index. A similar trend is developing in the longer end of the US Treasury curve – see Chart 2, with real 10 Year yields rising in tandem with increases in short term rates. This is important since US Treasury securities are consistently offering positive, inflation adjusted yields across all maturities for the first time since the end of the Great Financial Crisis. No longer do investors have to deploy capital in credit/equity risk assets to enhance purchasing power from their investment portfolios. However, with higher risk-free rates, corporations, businesses, and other economic entities face higher costs for both equity and debt capital, which dampens the incentive to invest. Similarly, higher borrowing costs suppress growth in consumer spending. As consumption and business investments are two key factors of economic growth, we see headwinds to both GDP and corporate profits going forward. The other key factor, government spending, is constrained by the accumulated level of government debt (estimated at 120% of GDP – see Chart 3, below).
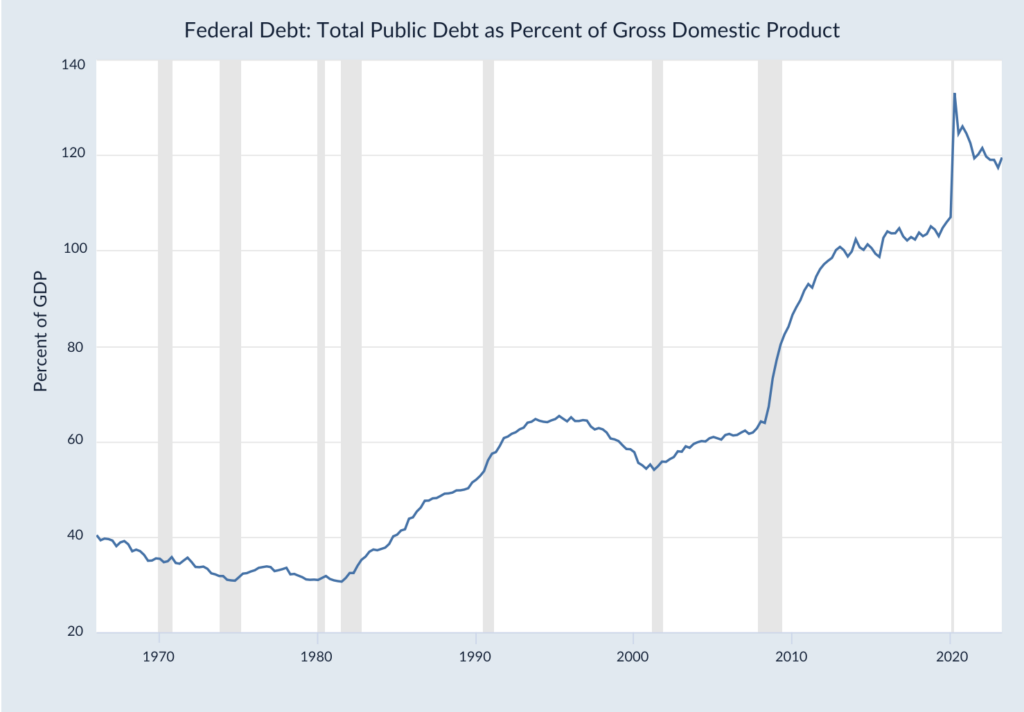
Chart 3. Source: US Office of Management & Budget, Federal Reserve Bank of St. Louis
Global GDP Growth Outlook
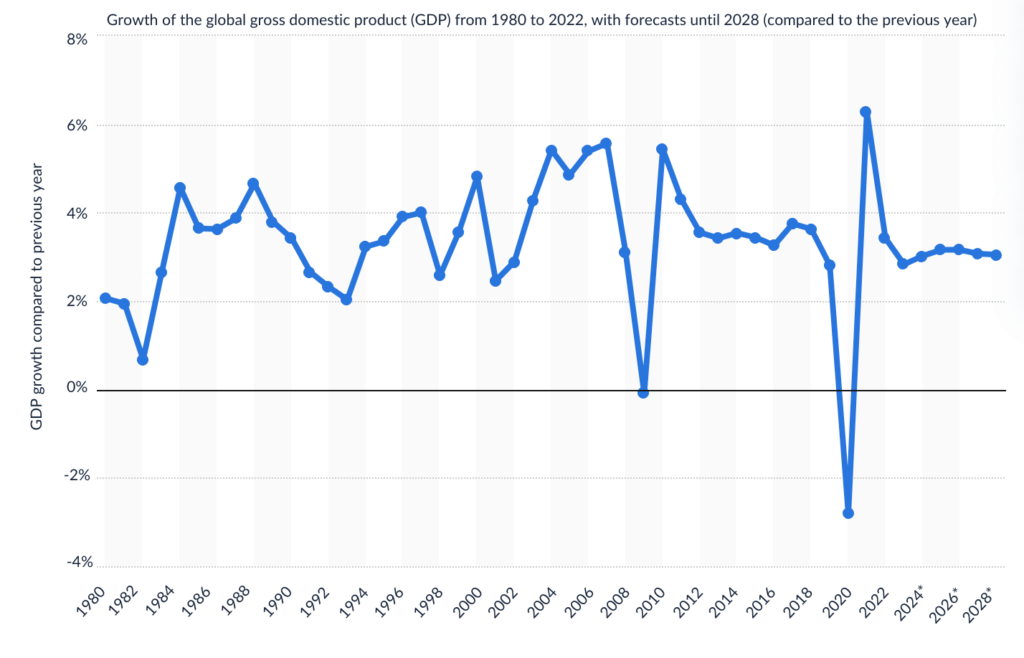
Chart 4. Source: IMF
Implications
Higher interest relative to the decade following the end of the Great Financial Crisis is now a global phenomenon, particularly following the disruptions in supply chains and the extraordinary expansion in money supply during Covid -19. As long as inflation remains above the Federal Reserve Bank’s 2% target, we do not expect the Fed to reduce the overnight Fed Funds rate absent a large geopolitical shock or a sudden unanticipated collapse in consumer spending or business investment. With major global central banks largely following the Fed’s monetary posture, the outlook for global growth is moderating which tempers our view on the performance outlook for riskier assets.
Private Assets
With the outlook for growth and earnings looking tempered going forward, we at Trajan Wealth believe that we can significantly enrich our clients’ investment outcomes by prudently allocating portions of their long-term investment portfolios towards private assets*. As mentioned in previous monthly newsletters, private assets are assets that are not traded in the public markets and include the equity – Private Equity, and debt – Private Credit of private companies, Private Commercial Real Estate, and Private Infrastructure Funds – pools of capital invested in private infrastructure projects, to name a few. Being private assets, these asset classes are significantly illiquid, taking as much as a decade for the return of and the returns on invested capital. However, they tend to command a veritable and persistent illiquidity premium – and since valuation changes only reflect durable changes in earnings and cash flow, they tend to be less volatile than publicly traded assets – the absence of momentum trades, short interest or short covering, algorithmic trading and leveraged trades that result in amplifying volatility in publicly traded assets.
Recommendations
We continue to advocate an elevated level of diversification across asset classes and develop specific asset allocation perimeters that cater to individual risk-tolerance thresholds. In the context of higher yields and the prospect of slower economic growth, Fixed Income assets should command a higher weighting in most portfolios. We also believe that non-traditional asset classes – “real assets” such as real estate and infrastructure, as well as private equity and private credit, merit consideration given the real portfolio enhancement opportunities as we transition to a potentially lower growth environment. With investors with a long-term investment horizon, the illiquidity premium in private assets is an attractive source of additional returns. The great news is that private assets, once the sole purview of institutional investors, are gradually being democratized with developments in technology and changes in the regulatory environment.
*May require accreditation.*
