“The global financial crisis – missed by most analysts – shows that most forecasters are poor at pricing in economic/financial risks, let alone geopolitical ones.”
~ Nouriel Roubini
Fed Policy, Economy, And Markets
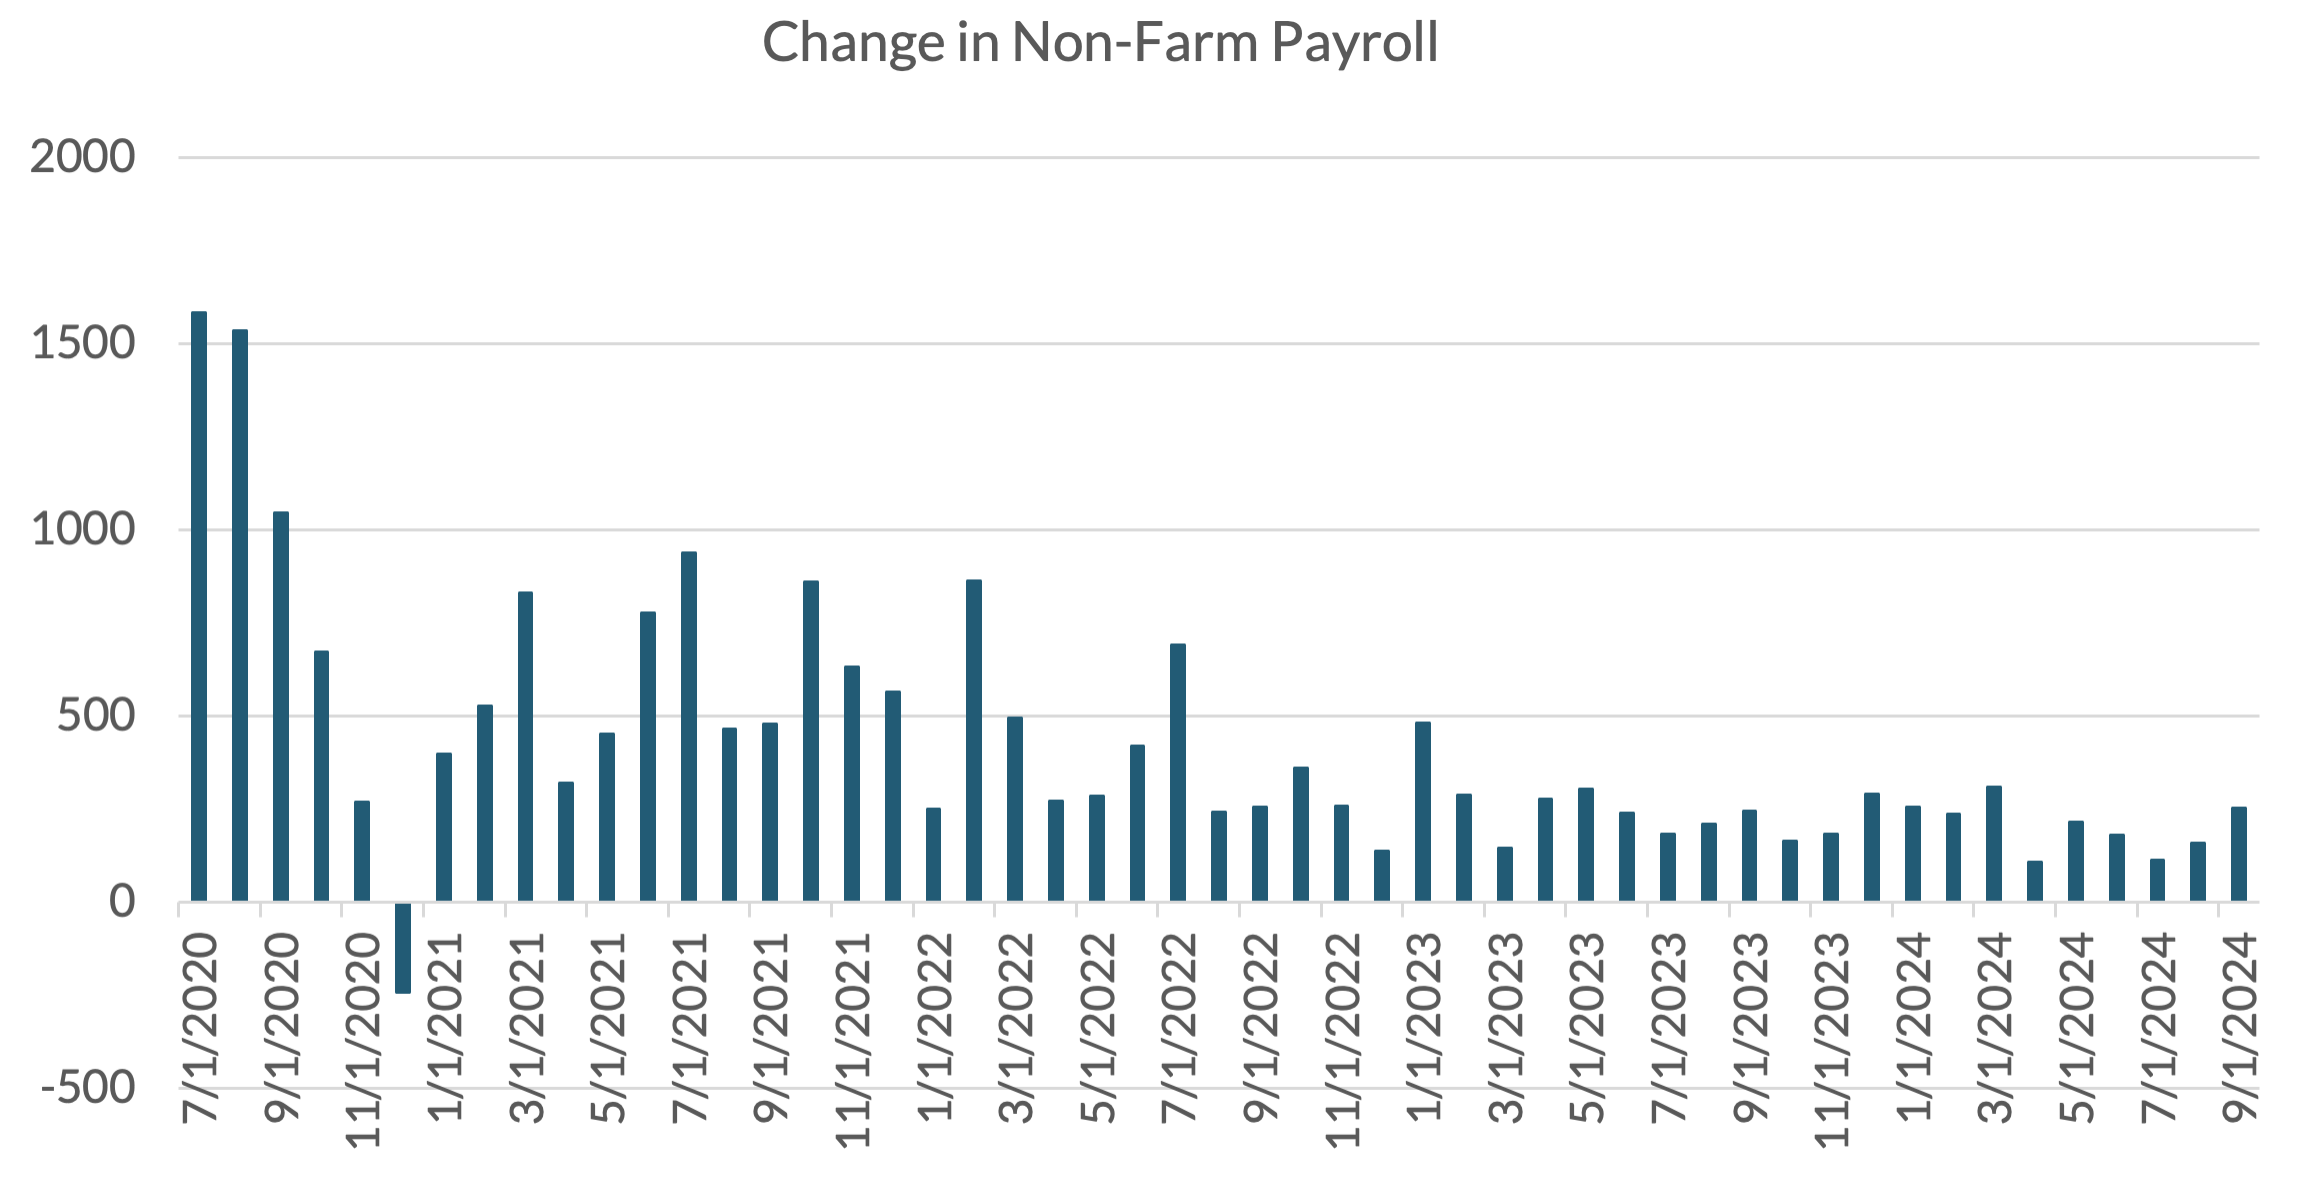
In September, investors witnessed a certain disconnect between developing economic uncertainties and the financial markets. Sharply rising geopolitical tensions in the Middle East and Ukraine suggest the ongoing wars in both regions might expand further, rather than move toward imminent resolutions. While it is callous to discuss the potential future impact of war escalation on the global economy given the horrific loss of human lives (there is increasing rhetoric of attacks on vital energy infrastructure), the risk of sharply slower growth and increased joblessness, cannot be totally dismissed. The loss of livelihoods is also a potential consequence of war and geopolitical tensions, and the markets are not yet pricing much of the associated risk. By contrast, the financial markets keep marching on despite the escalation in global tensions. The Fed, for its part, is supporting asset prices by accommodative policy; the FOMC cut overnight rates by 0.5% at their September meeting – a decision Chairman Powell justified by referring to growing signs of a cooling off in the US jobs market – see chart below. Still, the September employment report showed a robust 254,000 in new non-farm jobs, suggesting that absent the development of the worst-case geopolitical scenario, the US economy will remain vibrant.

i. Source – Bloomberg
| Indexii | YTD TR (%) | Sept 2024 Monthly TR |
|---|---|---|
| US Large Cap – S&P 500 | 22.08% | 2.14% |
| US Large Cap – Tech Heavy NASDAQ | 21.84% | 2.76% |
| International Equity – MSACWI ex US | 14.70% | 2.72% |
| US Small/Mid Cap – Russell 2500 | 11.30% | 1.49% |
| Bloomberg Aggregate Intermediate Bond Index | 4.45% | 1.34% |
ii. Source – Bloomberg
It goes without saying that we have little insight in forecasting or, indeed, pricing in geopolitical risk. My view with respect to wars is the outcomes are unknown and unknowable. Suffice to say, the best investors can do is base their asset allocations on their individual long-term financial goals and risk tolerance levels, while maintaining adequate liquidity (both through portfolio asset allocation and personal spending/saving levels) to sustain through extreme scenarios. For investors who are still very equity-heavy in their asset allocations due to the unusually low interest rate environment over the past decade, it may be appropriate to migrate a portion of their allocation to more senior sections of a company’s/real estate property’s capital structure, including both unsecured and secured debt. As is the case with any capital structure, equity holders bear the first loss in case of a diminution in the value of the company’s assets or if the entity starts generating operating losses. Having allocations to senior parts of the capital structure enables investors to accomplish partial protection against permanent capital losses, especially if the debt instruments are secured by specific assets.
Private Credit
One asset class that currently enables investors to allocate to the most senior part of a company’s capital structure while generating traditional public equity-like returns is Private Credit. Private Credit is a nomenclature that covers many types of debt instruments – the largest category of the asset class is senior, secured loans made by non-bank institutions to private companies owned by corporate private equity funds. The loans are made to “middle market” companies – which is to say, companies with operating cash flows below $100 million. The companies are not publicly traded and, as a result, do not file public quarterly or annual financial statements. Typically, the companies do not pay for credit ratings and are thus not credit rated by rating agencies such as Moody’s or S&P. Since the loan sizes are relatively small, and banks have to reserve sizeable equity capital to lend to unrated middle market companies, lending in the segment is gradually moving away from banks to large private credit funds.
Banks exiting lending in this segment are creating a funding “gap” that is being met by investor capital through private credit funds. The loans are “senior” – that is, the first to receive repayment by the obligor, and “secured,” which means, specific assets are pledged as collateral by the borrowing company to ensure high recovery should the company cease operations. The loans are also “floating,” – which means interest payments are tied to short-term bank lending benchmarks, which reset with FOMC rate changes. Given that private middle market lending is at an evolutionary stage with private funds disrupting/replacing commercial banks, annual interest payments are currently in the 8% -12% range, averaging about 10%. As our readers are aware, the long-term total return of the S&P 500 (dividends and capital appreciation) averages slightly north of 10%, with about 18% annualized volatility. Since senior debt payments are a contractual obligation rather than a claim on residual income (which public or private equity really represent), we feel the annual variation in private credit returns is intuitively more fixed income-like in the range of 5%-6%. In addition, in the private credit space, annual interest is paid in cash over quarterly payments, which enables quick reinvestment and considerable compounding benefits.
Risks

iii. Source/Credit – ZAIS Group
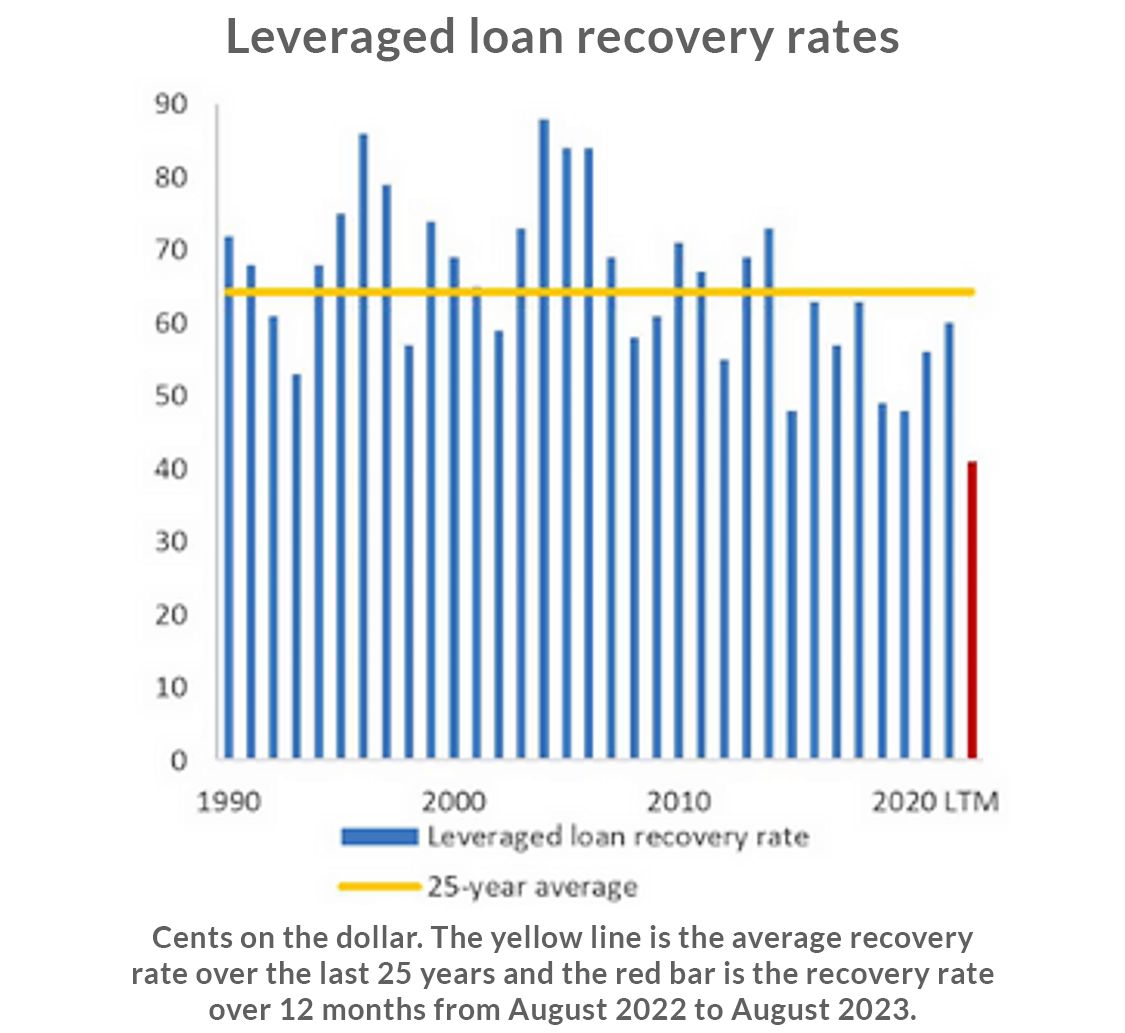
The risk in any loan/debt instrument is the inability of the borrower to fully pay the lender in accordance with the contracted credit terms – which is the timely payment of interest and the repayment of principal at loan/debt maturity. While data on private middle market loans provided by private funds to private equity sponsored companies is limited, data on a close proxy – broadly syndicated bank loans provided by banks to large US companies is comprehensive, both in scope (across many industries/companies) and through history. The charts marked “Leveraged Loan Default Rates” and “Leveraged Loan Recovery Rates” show both the “default” and “recovery” experience in the senior secured corporate lending over multiple decades. The key takeaway is that the highest default experience occurred during the Great Financial Crisis of 2008/09 when about 12% of all outstanding principal in the corporate bank loan space defaulted, yet recovery from the defaulted loans still averaged near 70%. Expressed in a separate way, the actual loss experience was about 3.6% (30% unrecovered from the 12 % defaulted loans). By way of long-term averages, the annual average default rate is less than 3% (see first chart above) and the recovery rate averages about 65% (see second chart above).
Recommendations
Considering the opportunity in Private Credit, we at Trajan Wealth are building a model Private Credit portfolio to enable our clients and prospects build allocations to an attractive sector in the Fixed Income asset class. The key caveat here is that there is limited liquidity in this sector (the loans are private), thus sizing the allocation appropriately in a well-diversified portfolio will be critical. We expect to roll this new product in Q1 of 2025. For help in reviewing your portfolios and making any necessary changes, please contact our Portfolio Management Group at 1 (800) 799-3320.
Learn More About Private Equities
*Private assets may require accreditation. All figures are hypothetical and do not reflect fees. Past performance is not an indicator of future performance. Your results may vary.


