Strong Q1 For Stocks Features Improved Breadth
Stocks started the year well: The S&P 500 delivered a 10% total return in the first quarter, though it gave back almost half of that gain in April. All eyes are on the Federal Reserve, as investors question how many rate cuts we’ll see in 2024 (if any!). Inflation has come down significantly from the peak of about 9% in mid-2022, but it remains stubbornly above the Fed’s 2% long-term target. By most other measures, the U.S. economy appears healthy, removing any urgency to reduce interest rates.
Big technology stocks continue to play an outsized role in market benchmarks, and enthusiasm for artificial intelligence is high. At the same time, we’ve seen improved breadth thus far in 2024, with sectors like energy, financials, and industrials contributing to the market’s advance. Real estate has been a laggard as property owners contend with secular pressures like office vacancies—hybrid and remote work are here to stay—along with sustained higher interest rates. There’s also concern about the health of the consumer, with high-profile consumer discretionary stocks like Starbucks, Tesla, and Lululemon underperforming this year.
Three Charts About Stocks and Elections
Regardless of their political views, many investors are nervous about the upcoming election—especially if the other guy wins. Presidents Biden and Trump may be “known quantities,” but there’s no telling how a second term might unfold for either of them. We went through all the Presidential elections since 1952 to see what we could learn.
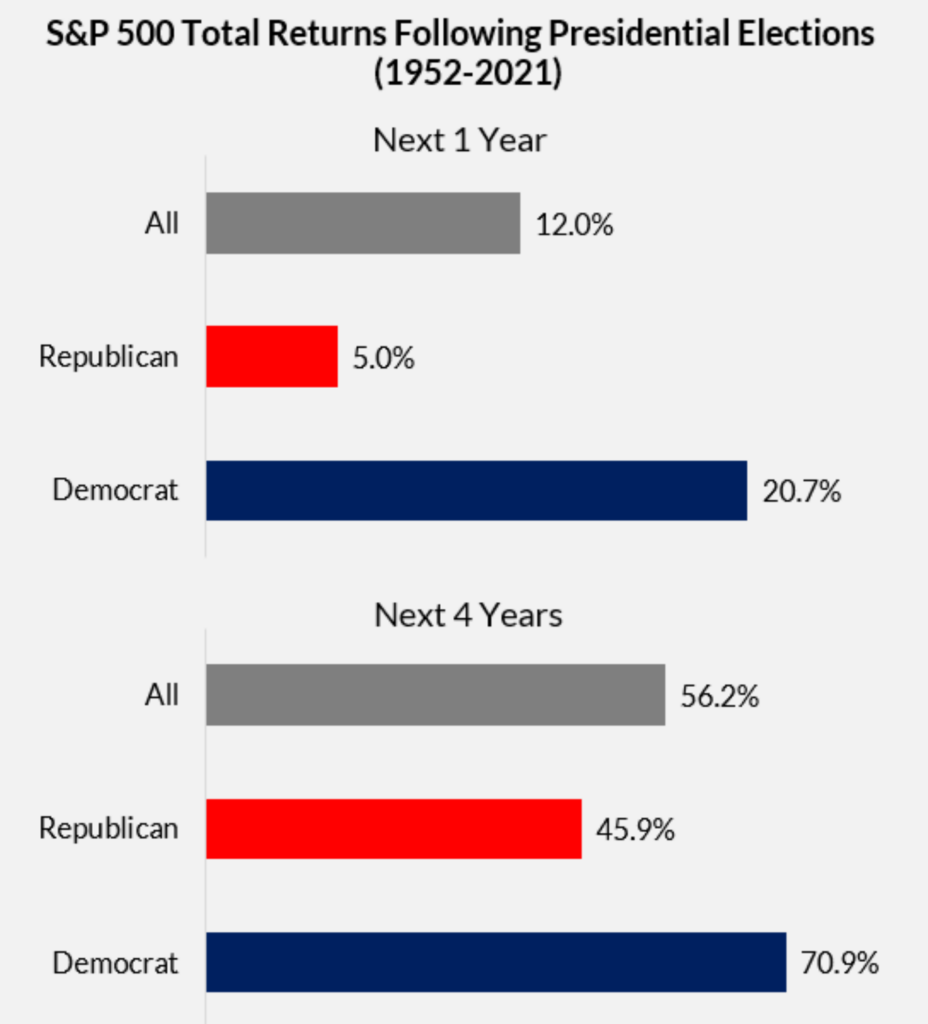
The S&P 500 typically does well in the 12 months following an election, rising an average of 12%. The benchmark historically did better under Democrats than Republicans, but returns have been strongly positive regardless of who won the election.
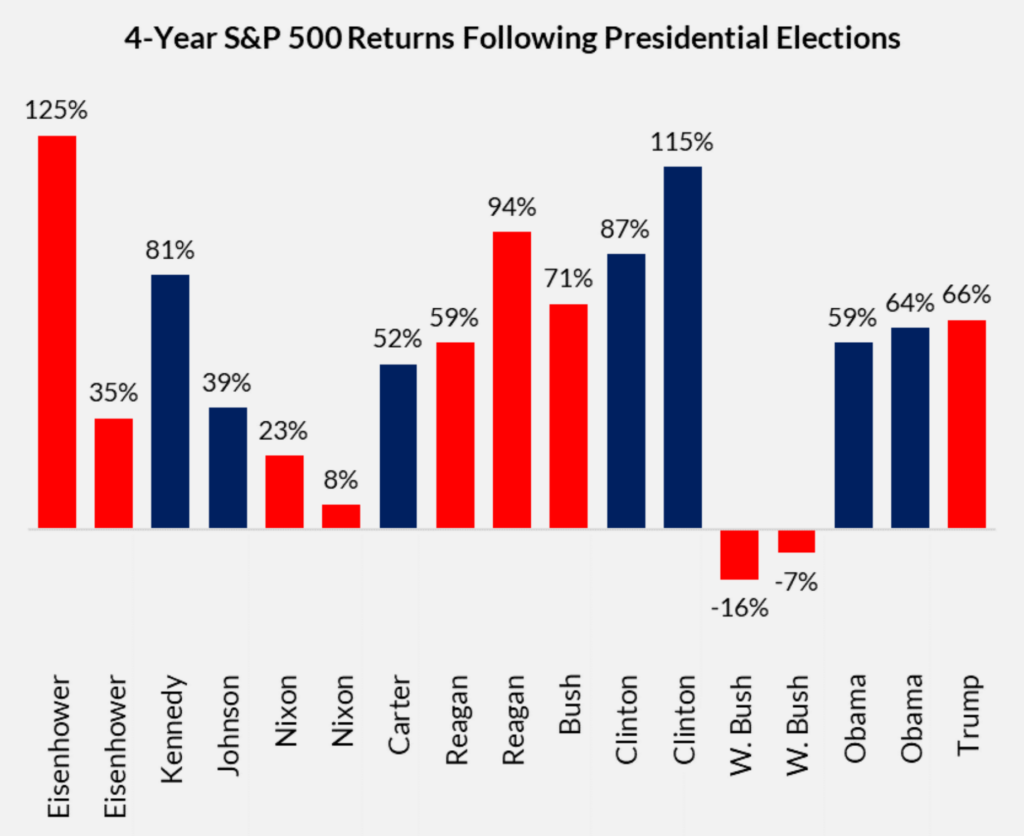
We encourage clients to express their political views at the ballot box, rather than through their portfolios. There are 1,000 different factors affecting the direction of the market—the President is only one of the 1,000. Think of all the other things going on in the world during past administrations. For example, Democrat Bill Clinton was in office during the dot-com bubble, which was a great time for stocks. Republican George W. Bush was elected just in time to see the dot-com bubble pop, then the 9/11 terrorist attacks, and finished his term near the trough of the 2008-09 financial crisis. Valuations were depressed by the time Democrat Barack Obama was elected, so he benefited from the post-crisis recovery.
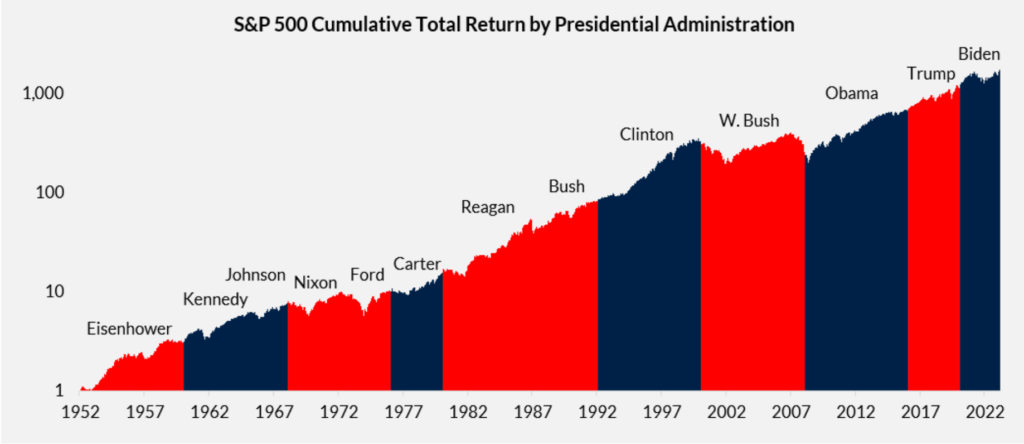
Across the 13 Presidential Administrations from Nov. 1952 through the end of 2023, the S&P 500 turned $1 into $1,706. That’s an 11% compound annual total return over 71 years. It’s a testament to the creativity of our scientists and technologists, the drive of our entrepreneurs and workers, and the robustness of our democracy and free markets. The United States truly is the land of opportunity, regardless of which party is in power.
Is Your Portfolio Ready For The Election?
Contact a Trajan Wealth fiduciary advisor to review your financial plan today!
The sources for all charts are Bloomberg and Trajan Wealth estimates. Data for the first chart is as of 3/28/24, including reinvested dividends and interest. The following ETFs were used to calculate returns: iShares Core S&P 500 (IVV) for the S&P 500, iShares MSCI ACWI ex US (ACWX) for global stocks, and iShares Core US Aggregate Bond (AGG) for bonds. Data for the second and third charts starts from November in the year of the election (inclusive). Data for the final chart is through year-end 2023.
