It’s Oh So Tempting.
But You’re Bound to Make A Mistake.
There’s a famous quote, usually attributed to Einstein: “Compound interest is the eighth wonder of the world. He who understands it, earns it; he who doesn’t, pays it.” That’s about as much personal finance wisdom as you can pack into two sentences. People who save a reasonable portion of their earnings, invest it in stocks and bonds, and allow it to compound for decades have a high probability of enjoying a comfortable retirement. Those who spend beyond their means and make up the difference with credit cards are destined for financial misery.
To find out how much an investment will be worth after t years, assuming the annual rate of return is r, simply multiply the initial principal by (1+r)^t. The table below shows what a $1,000 investment would be worth, assuming various rates of return and time periods.
Exhibit 1: Value of $1,000 After Compound Growth ($)
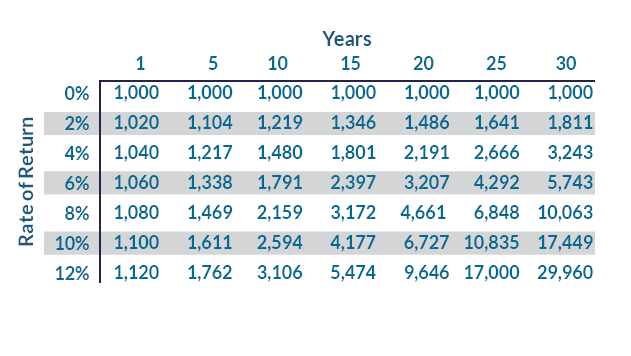
Source: Trajan estimates.
You can see why “eighth wonder of the world” wasn’t much of an exaggeration. Even with a 6% return, the 40-year-old who invests $1,000 today could expect to have $5,743 to spend when she’s 70. With a 10% return, she’d have $17,449. And with a 12% return, she’d have nearly 30 times her original investment. Try not to think about that the next time you’re enjoying a delightful $100 meal in a restaurant—the true cost may be three grand 30 years from now!
Three Reasons Why Market Timing Is a Bad Idea
As a portfolio manager, my stocks rarely keep me up at night. There will be winners and losers, but over a long enough investment horizon, I’m comfortable that a diversified portfolio of high-quality, reasonably priced businesses will deliver a satisfactory return. If the broader market cooperates and I do a really good job, maybe we’ll earn 10% or 12% per year. If we get a bad couple of decades in the market and I do a terrible job, maybe the return will only be 4% or 6% per year. But either way, an investor who sticks with it for 20 or 30 years should end up with multiples of their original investment and be a lot better off than if they had stuffed their money in a mattress.
What does disrupt my sleep is the thought that a client will get scared out of my strategies during one of the inevitable drawdowns, locking in their losses. Many investors have a natural panic response when the stock market is down: “I’ve already lost 20%, I can’t lose anymore!” I can’t even offer much reassurance during such periods. “Could the market continue to fall from here?” Unfortunately, the answer is always “yes.” There’s no telling what the market will do in the short term, and there have been a few times in history when stocks have fallen a lot more than 20%. The magic of compounding only works over the very long run.
Bear markets come with the territory when you invest in stocks. You could argue that investors’ aversion to these short-term losses is the main reason long-term returns have been so attractive. If the average investor weren’t so easily scared, stock prices would be much higher, and future returns would be lower. That brings me to three reasons why I think trying to time the market—trading in and out of stocks in an attempt to avoid corrections and bear markets—is a mistake:
1.) Long-Term Returns in the Stock Market Have Been Very Good, and Time Is On Your Side.
Earnings and cash flow are the ultimate drivers of a stock’s intrinsic value. While stock prices can fluctuate for all sorts of reasons in the short term, sooner or later, they should reflect the earnings capacity of the underlying business. As the global economy expands, businesses tend to grow their earnings. They return some of the cash flow to shareholders through dividends and share buybacks, and they reinvest the rest to support continued growth.
On his website, Yale professor Robert Shiller provides some valuable long-term data for the S&P 500 and predecessor indexes. Based on this data, over the past 100 years (from June 1922 to June 2022), large-cap U.S. stocks returned approximately 10.4% annually—enough to turn $1 into more than $20,000!
Of that 10.4% annual total return, 6.2 percentage points came from earnings growth and 4.0 percentage points from dividends, with less than 0.2 percentage points attributable to an expansion of the price/earnings multiple. The earnings growth can be further broken down into about 3.3% real growth and 2.9% annual inflation.
In my view, this is where the real money is made in the stock market—not in the buying and selling but in the holding. Patience is the most critical trait an investor can have. Earnings growth and dividends are the primary drivers of long-term total returns, but both take time, and there will be many ups and downs along the way.
The Shiller data can tell us more about what to expect from the stock market. The S&P 500 has delivered a negative total return in approximately 25% of one-year periods over the last 100 years. In other words, if you decided to sell all your stocks, hold cash for a year, and then buy back into the market, there’s about a 75% chance it would turn out to be a mistake. The odds get considerably worse over longer time horizons: The total return has been negative in only 12% of 5-year periods, 5% of 10-year periods, and 0% of 20-year periods. That’s right, the S&P 500 hasn’t delivered a negative total return over any 20-year period in the last 100 years. Even if you bought right before the 1929 crash and held through the Great Depression—suffering a peak-to-trough decline of almost 90%—you still would have been ahead by about 2% per year by the time 1949 came around.
The table below makes the same point. It shows the range of annual percentage returns over all the rolling 1-, 5-, 10-, and 20-year periods in the last 100 years. Pretty much anything can happen in a year: Total returns have ranged from negative 62.3% to positive 139.8%! Half of the time, the 1-year annual return has been either above 25.0% or below 0.3%. However, there’s much less variability over longer investment horizons. For 20-year holding periods, the annual return has been between 2% and 17.9%, and half of the time the return has stayed in a tight range between 7.7% and 13.3%.
Exhibit 2: Historical Annualized Total Returns (%)
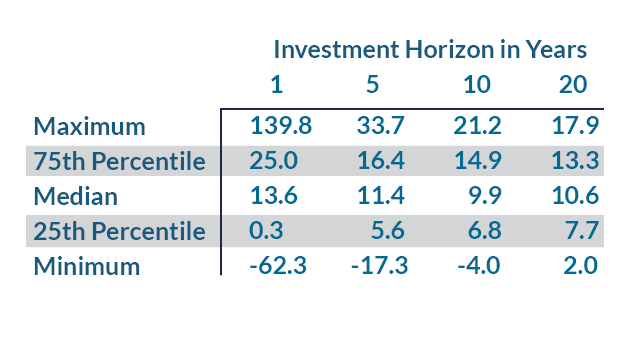
Source: Data from Robert Shiller, Trajan estimates.
2.) There is an Inverse Relationship Between Valuations and Future Returns.
Not many investors are eager to liquidate their accounts when they’re at an all-time high—it’s usually when they’re down 20% or more from a previous high that they start to get nervous.
I don’t find past stock price movements to be a useful input to the investment process. The fact a stock is down is neither a reason to buy or sell. Maybe it was too expensive before, and it’s only slightly less expensive now. Maybe there has been some fundamental deterioration in the business, which means intrinsic value is lower than previously believed. Or perhaps the stock offered a good long-term return before, and now the forward-looking return is even better. Without more information about the fundamentals of the business, the stock price by itself tells you almost nothing.
Rational investors should always try to look at a stock with fresh eyes. Assuming the long-term cash flow outlook of the business hasn’t materially changed, or has changed less than what’s implied by the stock’s decline, then the best course of action may be to hold or buy more. That’s because there’s an inverse relationship between valuations and future total returns.
This is obvious when it comes to bonds. Say a bond pays a $3 annual coupon and will return principal of $100 in one year. If the bond is trading at $100, the return will be 3%. But if the bond’s price declines to $97, the expected total return jumps to just over 6%. The decline in the price of the bond might have been painful, but that’s in the past—looking forward, it’s not a good reason to sell. The same dynamic applies to stocks. As long as the earnings power of the business hasn’t deteriorated, then a lower stock price means a higher earnings yield, greater returns from dividends and share repurchases, and the potential for future price/earnings multiple expansion.
3.) Past Bear Markets Show How Difficult It Is To Get The Timing Right.
Lastly, perhaps the best argument against market timing is to see how difficult it would have been to pull off in past downturns. Nothing makes an investor skeptical about market timing quite like failing at it in real-time, as I’ve learned from personal experience!
The coronavirus pandemic provides the most recent example. If ever there was a time for investors to be scared, it was early 2020 as people were forced to shelter at home, much of the global economy shut down, and U.S. unemployment spiked from 3.5% to 14.7% in just two months. The stock market’s initial reaction was about what you’d expect—from a peak on February 19 to a trough on March 23, the S&P 500 was down 34%.
Yet an investor looking at the market in mid-February would have needed exceptional foresight to guess what was coming. I know I didn’t appreciate the seriousness of the pandemic until Friday, March 13, when they announced my son’s school would be closing the following Monday. By then, it was too late for an investor to do much about it. Say you sold at the close on March 13, when the S&P 500 was already down about 20% from its February peak. You might have avoided another 17% decline before the March 23 low, but only if you bought back into the market on that exact day. If instead, you waited a month to buy back in on April 13, the S&P 500 was already above where you sold. If you waited until the end of the year, you would have missed a 39% gain!
It’s easy to look at a historical stock chart, find the highs and lows, and think, “Gee, if I just sell at the high and buy back in at the low, I can save myself a lot of money and stress!” The problem is that, in the moment, you have no idea where the highs and lows will be. There’s a big difference between saying that the market will be down 20% at some future time—which is a near certainty—and saying that it will be down 20% from the current price. If stocks go up 50% before they fall 20%, they will still end up 20% above where you started.
I’ll leave you with a quote from Peter Lynch: “Far more money has been lost by investors preparing for corrections, or trying to anticipate corrections, than has been lost in corrections themselves.” As painful as it can be to suffer through a bear market, that is the price of admission to enjoy the exceptional long-term returns offered by stocks.
Talk To Us Today!
If you’re interested in learning more about how Trajan Wealth can help you meet your financial goals, please contact us here or call 1 (800) 838-3079.
