The 30-year U.S. Treasury yield broke 5% in August 2026 for the first time since before the Great Financial Crisis, and forward market pricing implies 10-year yields could cross 6% within a decade. Two forces are driving it: inflation running persistently above the Fed’s 2% target, and a national debt that just passed $40 trillion, with interest payments now consuming nearly 20% of federal tax revenue.
Bond Yields Are Under Pressure
Fixed Income Market Update, August 25, 2026
The U.S. national debt passed $40 trillion last week [1], and the yield on the 30-year U.S. Treasury bond broke 5.30%,its highest level in nearly two decades. . For context, over the past three years the 30-year yield has ranged from 3.93% to 5.31%, with an average of approximately 4.66%. Some consider it to be a clear “canary in the coal mine” warning. Amid market concern over the pace of debt growth, the U.S. Treasury Department announced a doubling of bond buybacks from $2 billion to $4 billion, set to commence on September 9th, in what we view as an effort to push yields lower. The announcement worked for a single day before yields resumed their climb.
More notably, because the Treasury issues debt across a range of maturities, from 30-day bills to 30-year bonds, investors can readily project, or price in, future yields at various points along the curve. These “forward implied rates” have historically correlated (statistically speaking), to where future spot rates trend towards directionally – sources (FRB: The Information Content of Forward and Futures Prices: Market Expectations and the Price of Risk and https://www.pimco.com/us/en/insights/economic-and-market-commentary/secular-outlook/yield-advantage. The table below reflects forward rates as of this morning.
U.S. Treasury Forward Rates
| Tenor (Yrs) | Coupon (%) | 1YR | 2YR | 3YR | 5YR | 7YR | 10YR | 20YR | 30YR |
|---|---|---|---|---|---|---|---|---|---|
| 1 | 3.861 | 4.443 | 4.442 | 4.577 | 4.927 | 5.167 | 6.092 | 5.283 | 5.283 |
| 2 | 4.232 | 4.443 | 4.508 | 4.588 | 4.929 | 5.167 | 6.092 | 5.290 | 5.283 |
| 3 | 4.300 | 4.486 | 4.537 | 4.696 | 5.004 | 5.179 | 6.092 | 5.288 | 5.283 |
| 5 | 4.405 | 4.588 | 4.683 | 4.826 | 5.072 | 5.514 | 6.095 | 5.286 | 5.286 |
| 7 | 4.538 | 4.703 | 4.805 | 4.916 | 5.325 | 5.658 | 6.094 | 5.287 | 5.285 |
| 10 | 4.700 | 4.895 | 5.046 | 5.205 | 5.513 | 5.762 | 6.093 | 5.288 | 5.286 |
| 20 | 5.216 | 5.310 | 5.381 | 5.456 | 5.596 | 5.695 | 5.801 | 5.287 | 5.287 |
| 30 | 5.228 | 5.306 | 5.364 | 5.426 | 5.542 | 5.624 | 5.710 | 5.287 | 5.287 |
Reading the table horizontally from the current yield (the “Coupon (%)” column) shows the market’s projected yield at each future horizon. At the 10-year horizon, note and bond yields are projected to cross 6%, a level last seen on the 10-year note in March 2000. The 10-year note currently yields approximately 4.70%; before the start of the Iran conflict last February, it stood at roughly 3.95%. To be sure, we aren’t saying that bond yields in the future will cross 6% (that is to be determined), but the trendlines are heading in a higher direction The increase in spot rates over the past six months alone has been substantial; 30-year US Treasury yield has increased from about 4.60% since the end of February to about 5.25% by the end of August, culminating in a (9%+) erosion in principal value. Note that we aren’t making predictions, we are simply recognizing that pricing mechanisms in the bond market have informational value in projecting future outcomes.
Why Is This Happening?
Two factors are primarily responsible:
- Inflation has persistently remained above the FOMC’s 2% target and has risen by over 1 percentage point since the start of the Iran conflict last February (source – www.bls.gov/regions/mid-atlantic/data/consumerpriceindexhistorical_us_table.htm)
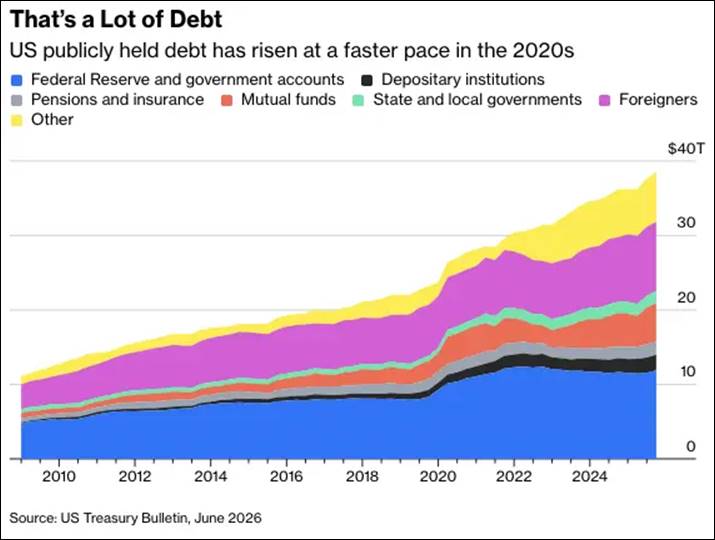
- More significantly, the trajectory of U.S. federal debt continues to climb, and interest payments alone now consume nearly 20% of federal tax revenues[4].
| Fiscal Year | Total Spending ($T) | Total Revenue ($T) | Deficit ($T) |
|---|---|---|---|
| 2015 | $3.69 | $3.25 | -$0.44 |
| 2017 | $3.98 | $3.32 | -$0.67 |
| 2019 | $4.45 | $3.46 | -$0.98 |
| 2020 (COVID Spike) | $6.55 | $3.42 | -$3.13 |
| 2021 | $6.82 | $4.05 | -$2.78 |
| 2022 | $6.27 | $4.90 | -$1.38 |
| 2023 | $6.13 | $4.44 | -$1.70 |
| 2024 | $6.75 | $4.92 | -$1.83 |
| 2025 | $6.92 | $5.07 | -$1.85 |
| 2026 (CBO Est.) | $7.21 | $5.11 | -$2.10 |
Context Behind the Recent Spike in Long-Term Yields
Treasury Secretary Scott Bessent announced a plan to double the Treasury’s long-bond buyback operations on Wednesday, August 19, 2026 [2].
The Intervention
The move increases the Treasury’s liquidity-support buybacks for longer-dated Treasury securities (10- to 30-year maturities) from $2 billion to at least $4 billion per operation.
The Catalyst
The intervention followed a surge in the 30-year Treasury yield past 5.3%, its highest level in nearly two decades, driven by concerns over persistent inflation, large budget deficits, and expanding national debt.
Market Reaction
The announcement briefly cooled the long end of the curve, pulling 30-year yields down to roughly 5.18%. The rally proved short-lived: by Thursday, August 20, 2026, yields had rebounded to 5.26%-plus as investors questioned whether the scale of the buyback could offset broader fiscal supply pressures.
My Views
The following reflects my own perspective, informed by 30 years in the rates markets.
- The U.S. Treasury is actively trying to keep long-term rates in check to support housing, corporate borrowing, and the financial sector (banks, insurers, and others), and by extension the broader economy. Even before last week’s “Operation Twist”-style intervention, buying long-dated bonds by issuing short-term bills and notes, the Treasury bought Japanese Yen in a Foreign Exchange intervention exercise to help the Japanese Government/Bank of Japan stem the downward pressure on the Yen. Ordinarily, the Bank of Japan would defend the yen by selling its reserves of U.S. Treasury notes and buying yen in the currency markets; instead, the U.S. Treasury prevented that by buying Japanese Yen denominated assets to support demand for the currency. A similar intervention by the form of a swap line (essentially, a borrowing and lending arrangement whereby the US Fed would lend US Dollars and borrow UAE Dirhams) was planned earlier with the United Arab Emirates as its currency came under pressure amid the Iran conflict. Note, both Japan and the UAE are large holders of US Treasury Debt – source (https://ticdata.treasury.gov/resource-center/data-chart-center/tic/Documents/slt_table5.html). In short, our view is that Secretary Bessent is actively intervening in foreign exchange markets to prevent the sale of long-dated U.S. Treasuries.
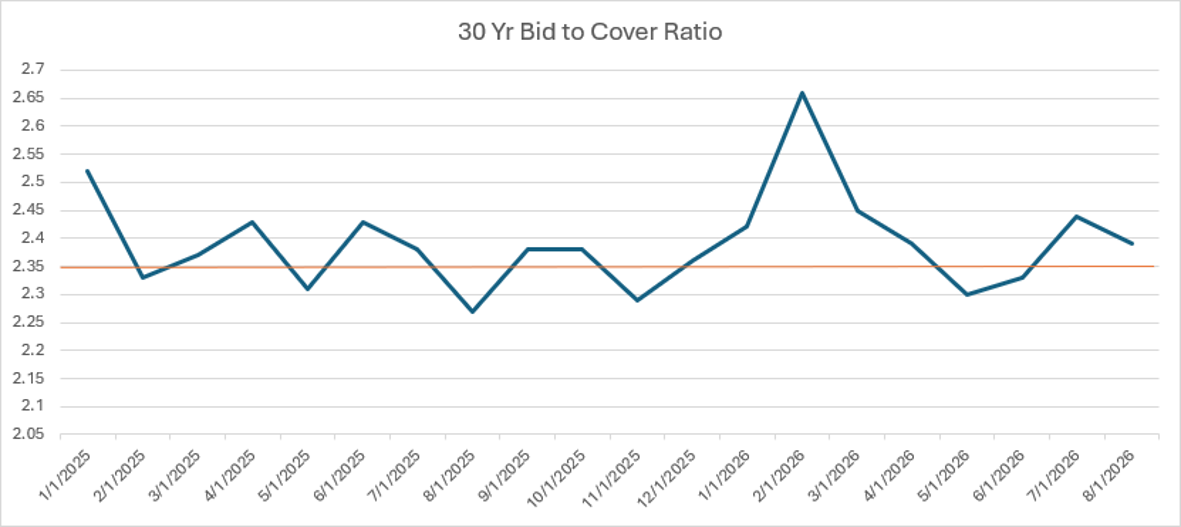
- On the evidence so far, this effort is falling short. The “bond market vigilantes,” a term from earlier decades, appear to be back. Recent Treasury auctions of long-dated notes and bonds have cleared at weaker bid-to-cover ratios, signaling softer demand and pushing clearing yields higher. In short, the market demand is trending against the Treasury’s interventions – see chart below. My view is that bond investors are increasingly concerned about the size of our deficits and the pace of debt growth.
- Unlike the period following the Great Financial Crisis, the U.S. Treasury is now increasingly competing with the “hyperscalers” for financing. Amazon, for example, brought notable AI-related capital expansion debt offerings to market in November 2025 ($15 billion), March 2026 ($37 billion), and July 2026 ($25 billion), adding meaningfully to the overall supply of debt in the capital markets. Equally important, the intervention measures following the GFC – high deficit spending by the US Treasury, Quantitative Easing programs by the Federal Reserve (through which the Fed bought US Government Debt) were executed when there were deflationary pressures prevailing in the economy, a sharp contrast to today’s persistent inflation environment.
Why Should We Care?
- Interest-rate-sensitive sectors, housing, banks, insurance companies, and highly leveraged companies generally, are highly exposed to a sustained rise in long-term borrowing costs.
- Many issuers may face refinancing challenges as higher rates require additional equity infusions.
- Banks and insurers, given their leveraged business models, also face the prospect of margin calls as the market value of their long-dated assets declines with rising yields.
- Credit ratings are an imperfect indicator. Bond yields and credit spreads have historically moved quickly when confidence deteriorates, and rating downgrades typically lag the market.
Five community banks have already failed in 2026. The most recent, Tioga-Franklin Savings Bank (Philadelphia, PA), closed on August 21, 2026 [3].
Protection Measures
A natural question arising from this analysis is whether we foresee a steep correction. That is the proverbial $64 million question, and we have no edge in predicting its timing or severity. That said, a steep and sustained rise in bond yields puts upward pressure on discount rates and downward pressure on market multiples. Key considerations for asset allocation:
- Mitigate Capital Loss Risk – Long duration assets are highly sensitive to rising yields. Be cautious of long-dated, fixed contractual payment obligations, whether they begin today or at some point in the future. These typically carry high duration, meaning greater exposure to rising interest rates.
- Focus on Quality Cash Flows- Within equities, high capital borrowing costs pinch highly leveraged companies. Prioritize quality firms with robust balance sheets and low reliance on floating-rate debt or near-term refinancing needs.
SOURCES
[1] National Debt Tops $40 Trillion After Doubling in Less Than a Decade, Treasury Data Shows, CBS News
[2] Bessent Deploys Debt Buybacks in Sign of Concern Over Yield Rise, Bloomberg
[3] Failed Bank Information for Tioga-Franklin Savings Bank, Philadelphia, PA, FDIC
[4] US Debt Hits $40 Trillion: Who Does Washington Owe and Why Does It Matter?, Al Jazeera
[5] U.S. Treasury forward rate and federal fiscal data: Trajan Wealth analysis. Proprietary data; not independently linkable.