
“Never take your eyes off cash flow because it is the lifeblood of business”
-Sir Richard Branson
Investing during periods of heightened uncertainty
At the Jackson Hole Economic Symposium at the end of August, FOMC Chairman Jerome Powell took a decidedly hawkish tone on the FOMC’s determination to bring inflation under control. True to his word, the Fed raised overnight rates by 75 basis points at the September 21st FOMC meeting. Chairman Powell reiterated his hawkish stance at the media event after the FOMC meeting. Meanwhile, the August headline Consumer Price Index (CPI) number released in September showed the persistence of elevated inflation – the actual YOY reading came in at 8.3%, substantially higher than the Fed’s 2% target. The prospect of further tightening in monetary policy caused a decline of (9.5)% in the S&P 500 and (3.5)% in the Barclays Capital US Intermediate Bond Index, the most widely followed proxies for the US stock and bond markets, respectively. At this juncture, we feel it is necessary to take stock of investment portfolios and look at valuations across asset classes.
Equities & Free Cash flows
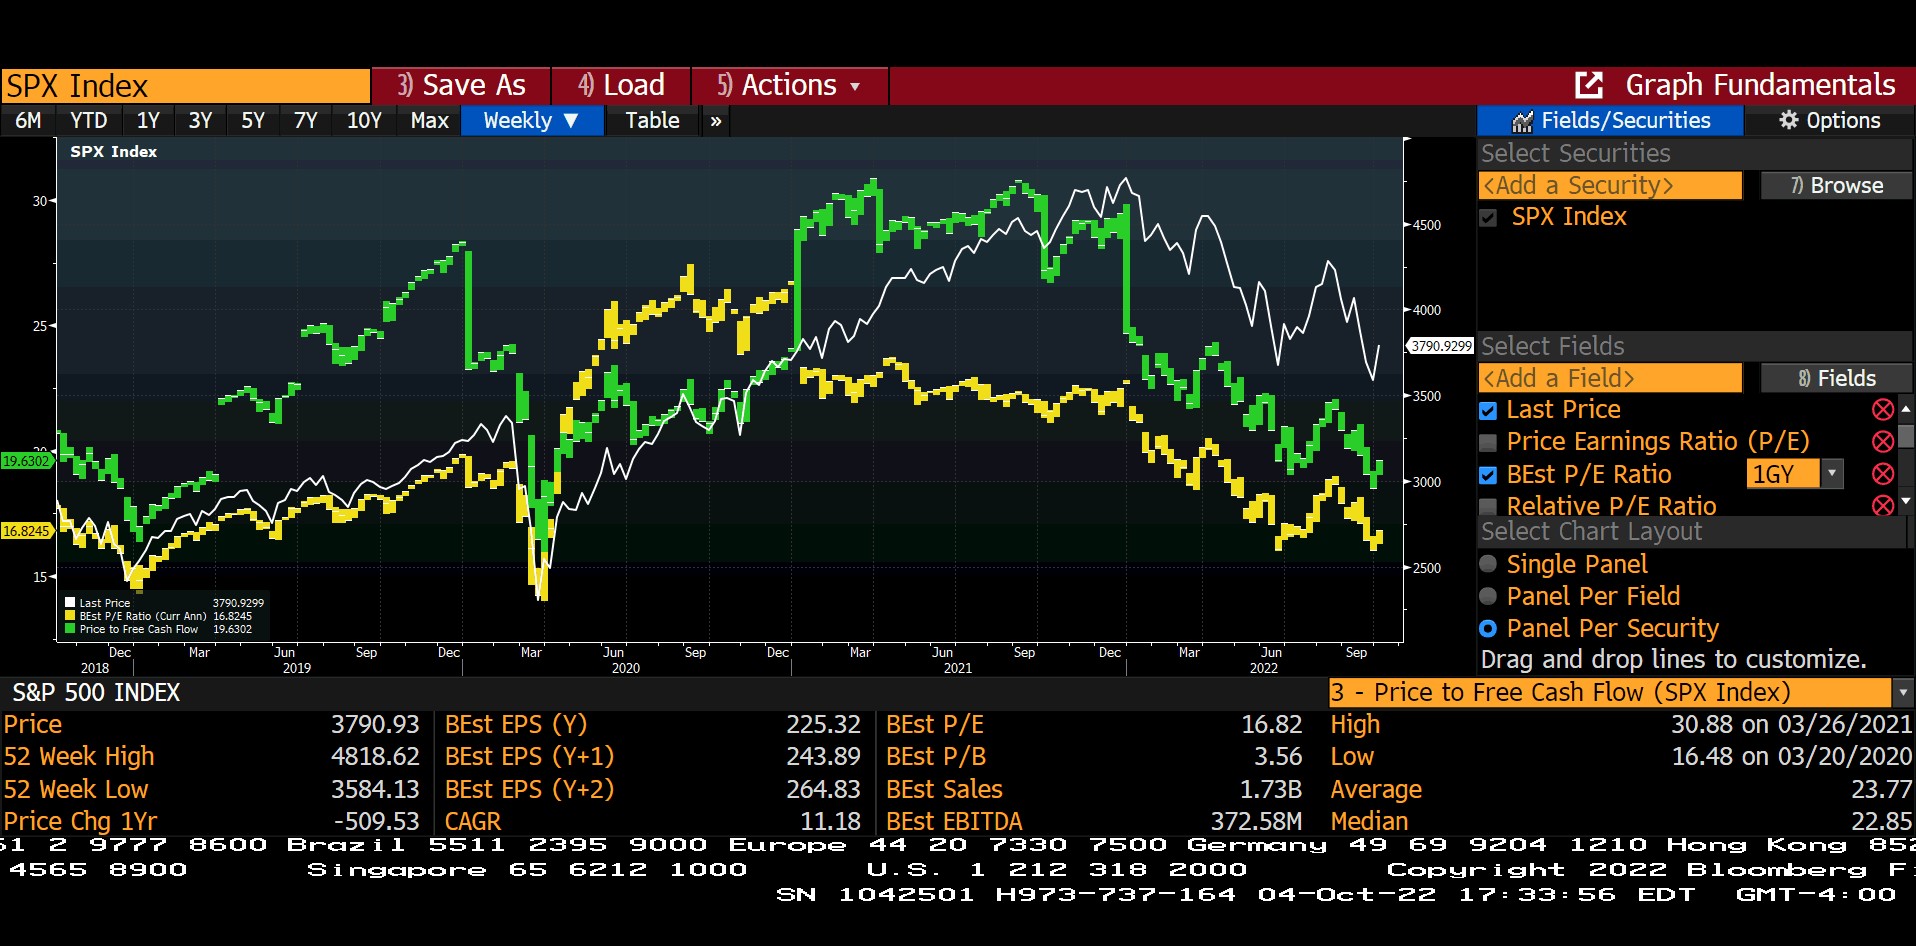
(P/E, P/FCF Ratios)
For investors with a long-term focus, we believe there is a compelling argument for staying invested and focusing on long-term goals. With the year-to-date sell-off in the equity markets, the S&P 500 is now trading at 17x earnings. More tellingly, it’s also at 20x Free Cash Flow. Free cash flow indicates the amount of cash generated each year that is free and clear of all internal or external obligations. (See green and yellow trend lines in the previous chart). Thus, the cash flow yield of the S&P 500 is 5.0% (20 times $1 of cash flow equates to a 5.0% yield – $1/$20). Add to that the FOMC’s long-term inflation target of 2.0%, and our expected cash return on US equities is 7.0% over a full market cycle. Compounding at 7%, money invested today doubles in 10 years. If the average 7.0% return persists, today’s money will quadruple in 20 years. In a similar vein, bond yields on well-diversified US Investment Grade fixed income portfolios are approaching 5%, relative to less than 2% a year ago, with enhanced compounding opportunities if a fixed income allocation is held for the long run.
US Non-Financial Corporate Debt Issuance & 10-Yr Treasury Yield
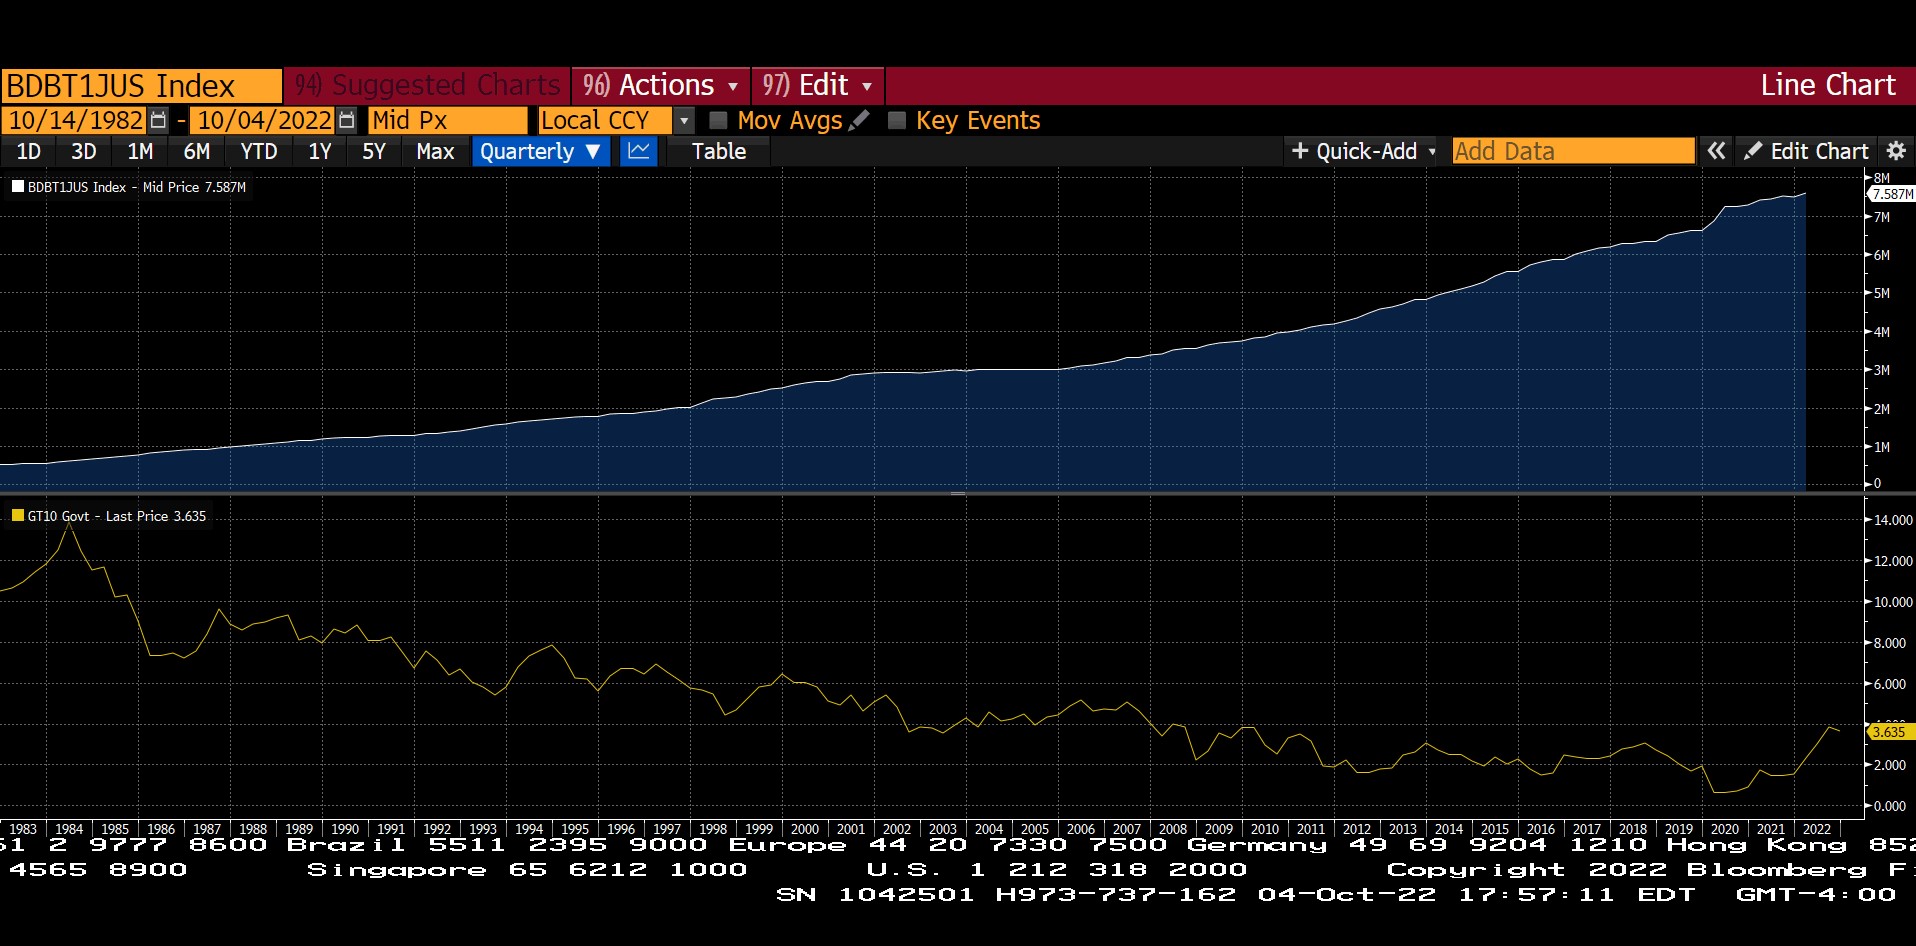
While painting this compelling scenario, we at Trajan Wealth would be in breach of our fiduciary duty if we failed to mention the risks involved in actually realizing the total return possibilities. Higher interest rates equate to higher debt servicing costs for debt-financed entities. The chart below shows the growth of debt issuance by non-financial US corporations over the last four decades. Since corporate debt maturities average between 5-10 years, increased issuance almost certainly equates to rapid increases in the stock of corporate debt outstanding. In the chart above, the yellow series at the bottom illustrates the trend line of the yield on the benchmark 10-year US Treasury. For the majority of the last four decades, Treasury yields were falling, increasing the capacity of borrowers to raise debt and successfully service debt servicing obligations. However, this trend is reversing, and borrowing costs are rising briskly.
Thus, it is eminently possible that highly leveraged entities might find servicing and refinancing their debt obligations appreciably more difficult, leading to a spate of bankruptcies and reorganizations going forward. As such, Trajan Wealth maintains a distinctive “quality bias” (less leveraged issuers, demonstrable track record of growing cash flows) in our actively managed portfolios.
Global indebtedness?
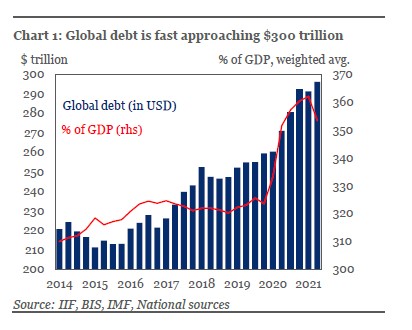
Similarly, Trajan Wealth looks at the macro-economic debt statistics as we build our asset allocations in our core, multi-asset class asset allocation strategies. As mentioned in our August newsletter, a steep rise in global indebtedness is an increasing concern, especially at a time of rising interest rates across many industrial and emerging economies. We believe that many sovereign issuers will experience difficulty servicing and refinancing their foreign currency-denominated debt, with acute economic consequences for their private sector corporations, banks, and individual consumers. Therefore, we are overweighting US assets since the US Dollar remains the world’s only reserve currency and US Debt/GDP ratios remain significantly below other industrialized economies – notably Japan and Western Europe.
Inflation Trajectory
The other significant risk factor going forward is the apparent persistence of headline inflation, and by extension, the future trajectory of interest rates, both in the US and across the developed and developing world.
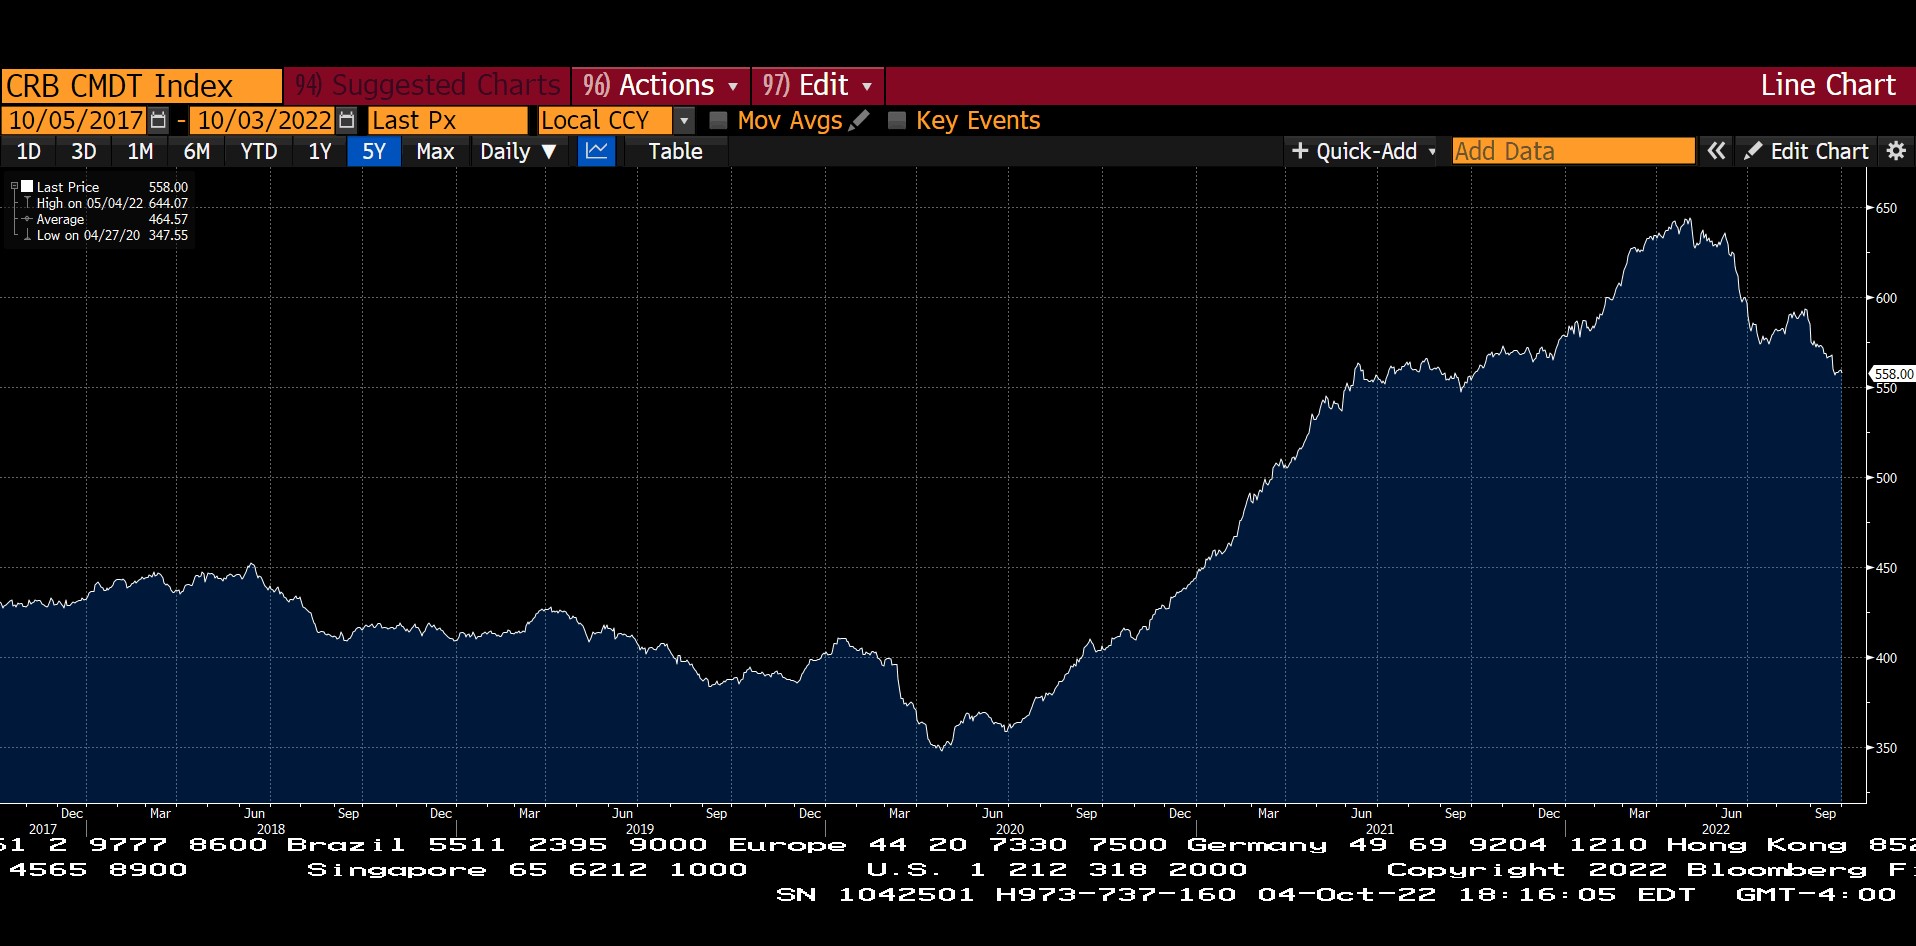
Two major components of inflation include commodity prices and labor costs – or simply wage inflation. On both, we are seeing some early signs of moderation in the forward-looking indicators, despite lagged readings, such as the CPI remaining elevated. Inflation readings, by definition, are backward-looking – month over the prior month, year over the preceding year. However, commodity futures – bets on the future price of commodities give us an idea of forward price expectations. Similarly, wage increases relative to current price increases give us an idea of future purchasing power and, by extension, future consumer demand and spending.
Commodities
Real Wages
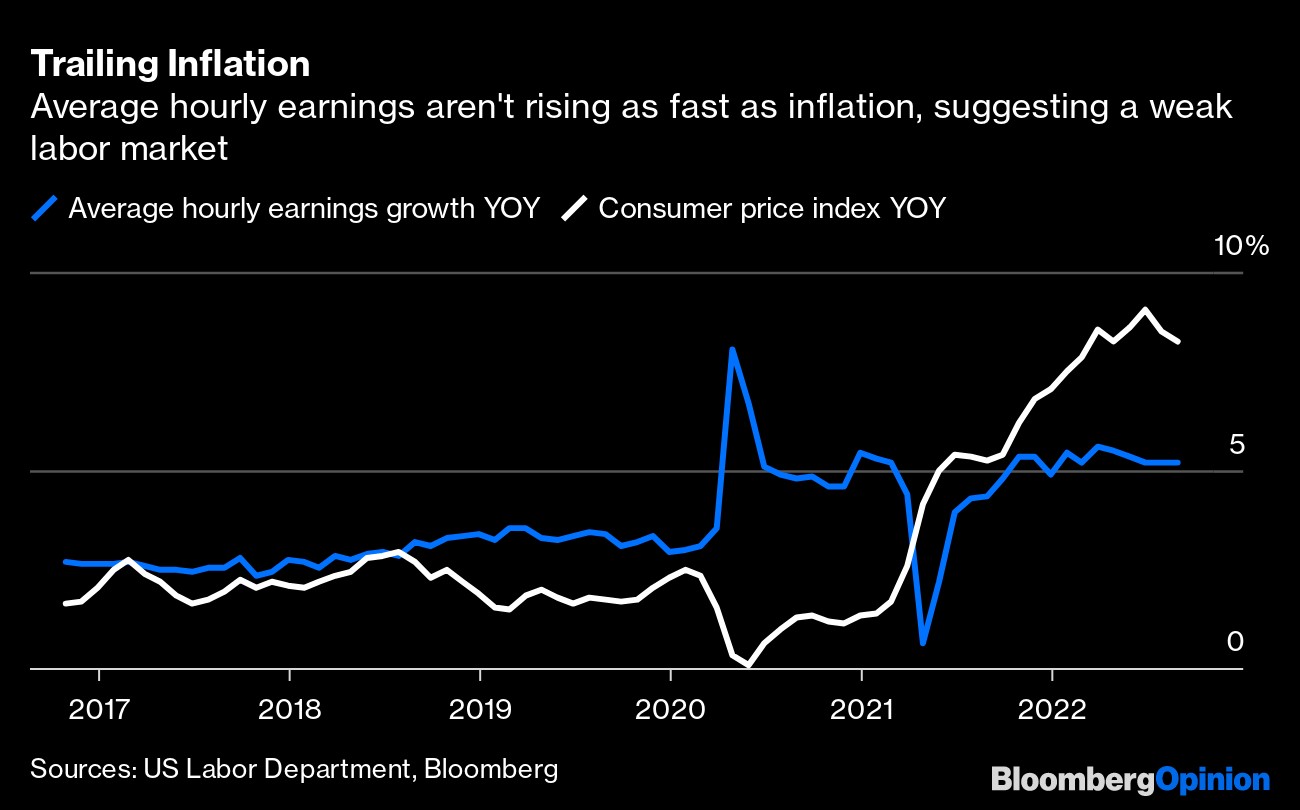
implications
While not declaring victory over inflation yet, we believe the markets are compellingly priced for investors with a long-term focus. Furthermore, early signs are pointing towards moderating inflation. With growing debt levels, however, we feel it is essential to focus on quality and cash flow when making investment decisions. High-quality assets are our preferred strategy at this time of elevated risk and uncertainty.
recommendations
As investment practitioners, we continue to advocate an elevated level of diversification across asset classes following individual risk-tolerance thresholds. However, we believe that non-traditional asset classes – “real assets” such as real estate merit consideration in light of persisting inflationary pressures. We also expect elevated levels of market volatility going forward, if only due to rapidly rising financing costs. As such, absolute return strategies – trend following, equity/credit market dispersion, which benefit from volatility may be appropriate for certain investors in an overall asset allocation. We continuously look for these unique sources of returns for our clients and will make recommendations as we develop additional strategies and updated asset allocation models.
In summary, with higher financing costs, lower projected growth, and an uncertain geopolitical environment, we would advocate a distinctive “quality bias” in overall portfolio management, overweighting issuers with low debt and discernible pricing power. Furthermore, history has proven the efficacy and regeneration capacity of the US economy and US financial markets in periods of economic and market distress – the self-correcting mechanisms of capitalism and free enterprise have decisively delivered better outcomes than its alternatives. As such, we are maintaining a measure of “home country bias” in our portfolio construction strategies.
UDAYAN MITRA, CFA
Trajan Wealth Chief Investment Officer