Earnings Growth, Dividends, and Valuations Drive Long-Term Stock Returns
Stock prices fluctuate for all sorts of reasons in the short term. Sometimes the moves make sense: A company wins a big contract, and the stock price goes up; a class-action lawsuit is filed, and the stock price goes down. Other times, fluctuations can seem irrational, such as when a “meme stock” catches fire because of a tweet or Reddit thread.
It’s only in the long term that business fundamentals shine through. Specifically, the long-term return from a stock is determined by its dividend yield, earnings per share growth, and changes in the price/earnings ratio.
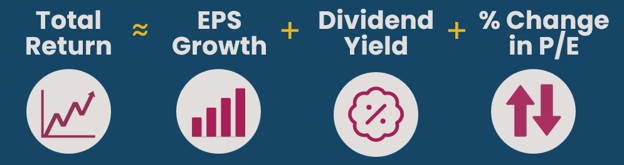
To outperform a market benchmark, active investors typically need to be better than the benchmark along at least one of these dimensions. For example, “growth investors” look for companies that are growing their earnings faster than the benchmark. “Dividend investors” look for stocks with above-average yields. And “value investors” look for stocks trading at below-market price/earnings ratios, hoping the valuation will rise over time. It can be especially powerful when all these factors are pulled in the same direction.
Real-World Examples
What does this look like in the real world? Let’s consider a few examples. (All examples based on Bloomberg data as of July 17, 2026.)
1) Eli Lilly (LLY) Eli Lilly has delivered explosive earnings growth thanks to the breakout success of weight-loss and diabetes drugs such as Mounjaro and Zepbound. As a result, Lilly’s stock returned 432% over the past five years. Adjusted earnings per share are up about 331% during that time; reinvested dividends contributed another 24%, and the remaining 77 percentage points came from a higher P/E on higher earnings.
2) PayPal (PYPL) By contrast, PayPal demonstrates the perils of a company not living up to investors’ high expectations. PayPal’s stock was down nearly 81% over the past five years, despite a recent acquisition proposal. Adjusted earnings grew 38% during this time, but the price/earnings ratio collapsed from more than 75x to less than 11x. Investors lost faith in PayPal’s long-term growth prospects amid rising competition from Apple Pay, Google Pay, Stripe, and others.
3) Altria (MO) Lastly, tobacco company Altria provides an example of dividend-led returns. The stock returned 131% over the past five years, with 75 percentage points attributable to reinvested dividends. Altria’s annual dividend yield has generally hovered in the high single digits. Adjusted earnings per share increased about 23% during this time, and the rest of the return came from moderate P/E expansion as investors witnessed Altria’s ability to offset volume declines with price increases.
Drivers of Long-Term S&P 500 Returns
How about for the market as a whole? Over the past 100 years, the S&P 500 has returned 10.4% per year. About 5.4% of the S&P’s return came from earnings growth (2.4% real growth + 3.0% annual inflation). Another 3.9% came from reinvested dividends. Only about 1.1% came from a gradual rise in price/earnings ratios.

Source: Shillerdata.com, Trajan Wealth estimates.
Investors would do well to ignore the daily noise of stock price volatility and focus on the fundamentals. Earnings growth and dividends are what really drive stocks in the long term.
Talk With Trajan Wealth
Is your portfolio fundamentally sound? Contact a Trajan Wealth fiduciary advisor for a complimentary portfolio review.
FAQ
Disclosure: Examples are for illustrative purposes only and are not intended as investment advice. Past performance doesn’t guarantee future results. Clients or employees of Trajan Wealth may have positions in securities mentioned. Sources: Bloomberg, Shillerdata.com, Trajan Wealth estimates