
Equity Markets – The Year in Review
“I don’t look to jump over seven-foot bars; I look around for one-foot bars that I can step over.”
-Warren Buffett
US Equities – S&P in 2022I
With 2022 in the rear-view mirror, I would plainly like to state the obvious – investors across all major asset classes experienced sizeable drawdowns in their investment portfolios. Since the S&P 500 index and its constituent stocks represent the most pervasively held financial assets in our client portfolios, we feel it helps to have a picture of the events that shaped the drawdown of the US public equity asset class during the course of 2022. The chart below depicts the downward trend; note the distinct sell-off following the commencement of Fed rate hikes in March 2022. For the statistically inclined, the S&P 500 ended the year down (18.1)%, the worst-performing year since the Financial Crisis in 2008, when the index was down (37.0)%. The primary determinant was the Federal Reserve Bank’s pivot on monetary policy – the FOMC raised the overnight Fed Funds rate by a cumulative 4.25%, the largest annual increase in over three decades.

US Fixed IncomeII
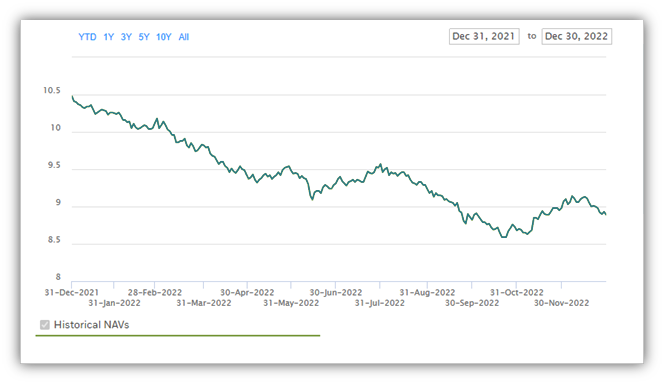
A similar story emerges in the US Fixed Income market. The chart below depicts the fall in prices (NAV) of the iShares US Bond Index Fund, an exchange-traded Fund that tracks the Bloomberg Aggregate US Intermediate Bond Index. Note the index tracks high-quality, investment-grade bonds and started the year with an average duration of 6.8 years and an average yield of 1.86%. Following the rise in interest rates throughout 2022, the index returned (13.01)%, with an equal decline in the NAVs or prices of index-tracking ETFs. Currently, the index yields 4.64% with an average duration of 6.2 years.
Current Valuation of Fixed Income & US EquityIII
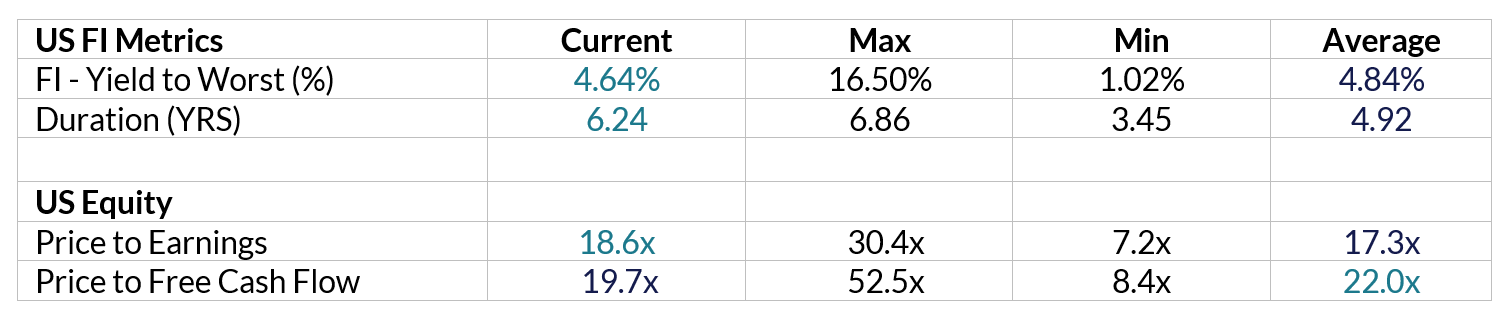
As illustrated in the above chart, tightening monetary policy and higher interest rates, while painful in 2022, has brought valuation in the broad asset classes decidedly towards their long-term averages. Entering the US equity market today by buying/holding the S&P 500, investors are effectively paying about 20x the most recent 1-year free cash flows of about 19x the most recent 1-year earnings. This is very much in line with long-term averages – 22x for Free cash flows and about 17x for a full year’s earnings. Future growth in the S&P 500’s Earnings Per Share is the unknown factor; historically, EPS growth has averaged about 6.5%. It does not seem unreasonable to expect a commensurate growth in EPS in the decade going forward. Arguably, with evolving technologies and increased factor (labor plus high technology investments) productivity, there may be an upside to long-term EPS growth. However, this should be tempered with the higher debt servicing burdens we discussed in previous newsletters.
The bond market also looks reasonable from a valuation perspective. Currently, core, investment grade-bonds are yielding 4.64%, within 20 basis points of the long-term average of the Bloomberg Aggregate Index. Unfortunately, the risk level (measured by duration) is significantly higher, given elevated debt issuance in the past couple of years and mortgage extensions due to the sharp rise in interest rates over the past 12 months. Notwithstanding the risk of additional rate increases by Federal Reserve Policy Makers current yields look compelling given the expected slowdown in near-term GDP growth and the likelihood that policy makers will pause their rate hikes by the middle of 2023.
Risk Factors Going Into 2023
We continue to believe that high global indebtedness poses a distinct refinancing challenge for lower-quality issuers. This risk is amplified in the event of slow or receding economic growth. In addition, the global geopolitical risk remains elevated, and the traditional lever of credit growth to support consumer and investment spending in the event of a recession has been severely curtailed.
Global Indebtedness – Relatively SpeakingIV
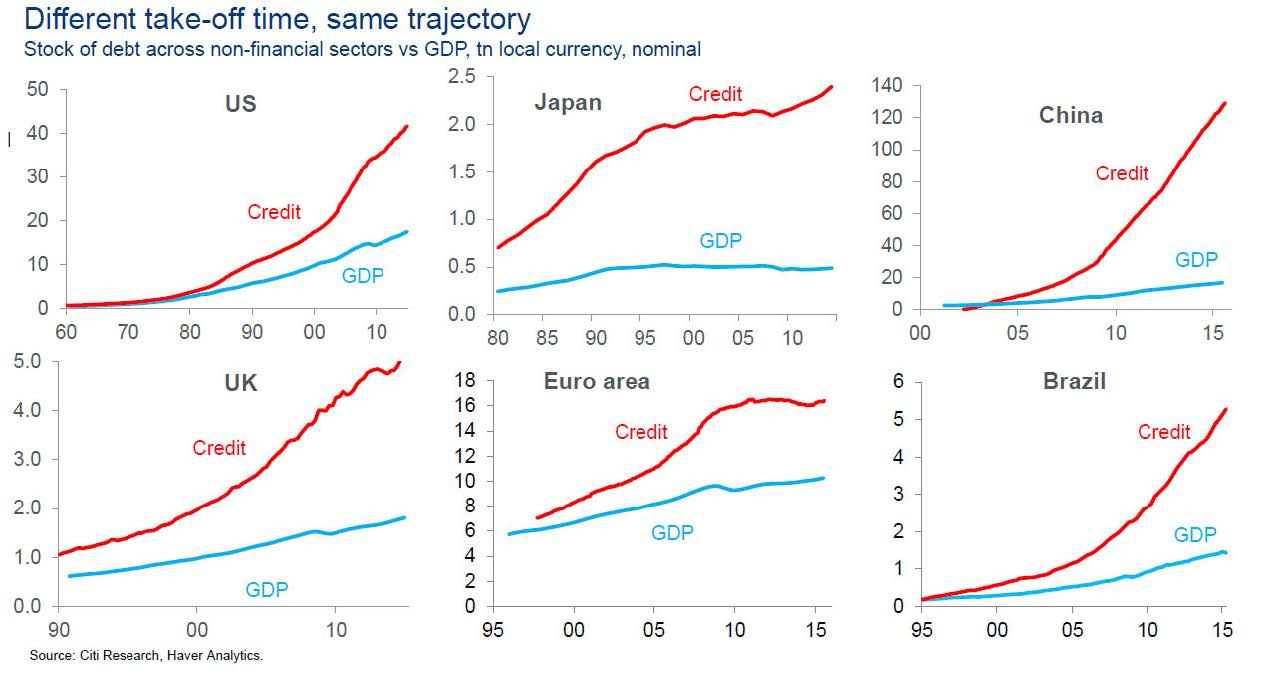
In view of the rising levels of global indebtedness, we advocate a more “active” portfolio management approach, designed to overweight quality, and take calculated risks in more “opportunistic” investment themes. In terms of quality, we will maintain a “home country bias” in our core asset allocation models; a strategy underpinned by our view that the US economy has a higher ability to navigate financial/economic shocks than most of our competitors. However, we will also opportunistically overweight certain Emerging Market indices where we believe the reward-to-risk metrics (valuation levels vs. growth projections) look compelling. In the credit (bond) markets, we will keep overweighting US assets, and maintain a strong bias towards higher quality issuers.
Recommendations…
We continue to advocate a broadly diversified portfolio based on individual risk-tolerance thresholds. In this context, Fixed Income assets should command a higher weighting. However, we also believe that non-traditional asset classes – “real assets” such as real estate merit consideration in light of persisting inflationary pressures. We also expect elevated levels of market volatility going forward, if only due to rapidly rising financing costs that may adversely affect corporate profits. As such, absolute return strategies – trend-following and equity/credit market dispersion, which benefit from volatility, may be appropriate for certain investors in an overall asset allocation. We continuously look for these unique sources of returns for our clients and will make recommendations as we develop additional strategies and update our asset allocation models.
In summary, with higher financing costs, lower projected growth, and an uncertain geopolitical environment, we would advocate a distinctive “quality bias” in overall portfolio management, overweighting issuers with low debt and discernible pricing power. Furthermore, history has proven the efficacy and regeneration capacity of the US economy and US financial markets in periods of economic and market distress – the self-correcting mechanisms of capitalism and free enterprise have decisively delivered better outcomes than its alternatives.
UDAYAN MITRA, CFA
Trajan Wealth Chief Investment Officer